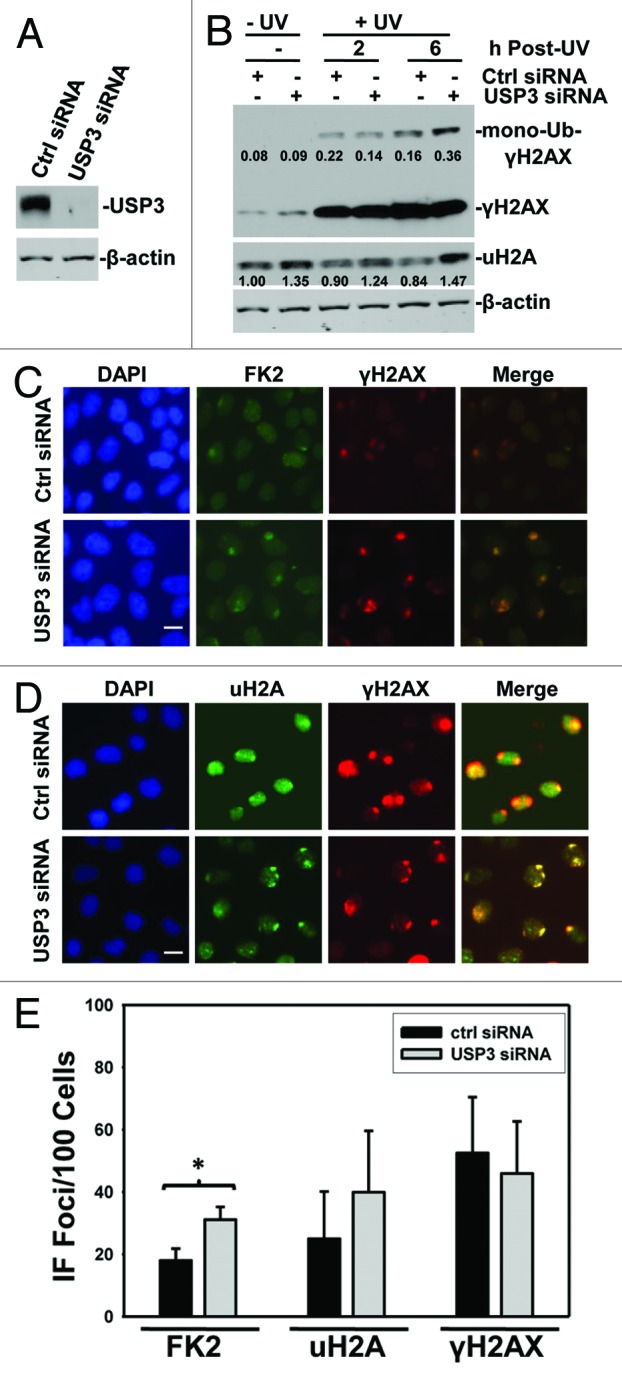
Figure 1. USP3 deubiquitinates γH2AX upon UV irradiation. (A) HeLa cells were transfected with USP3 or control siRNA at a final concentration of 100 nM. The cells were harvested 48 h after transfection. Knockdown efficiency of USP3 siRNA was analyzed by immunoblotting with USP3 antibody. (B) HeLa cells were transfected with siRNA as in (A) and UV-irradiated at 20 J/m2. Cell lysates were prepared at indicated time points and the levels of Ub-conjugates of γH2AX and uH2A were determined by immunoblotting using γH2AX and uH2A antibodies. The protein images in blots were quantitated by ImageJ software, and the number represents relative amount of mono-Ub-γH2AX to γH2AX, and uH2A to that of Ctrl siRNA without UV. (C) HeLa cells were treated as in (A) and UV-irradiated at 100 J/m2 through a 5-μm micropore filter placed on cell monolayers. Six hours after UV irradiation, cells were processed for immunofluorescent staining with FK2 and γH2AX antibodies. The images are representative of multiple experiments. Calibration bar is 10 μm. (D) Cells were treated as described in (C), and the immunofluorescent staining was performed using uH2A and γH2AX antibodies. Calibration bar is 10 μm. (E) Duplicate experiments were performed as described in (C), and the cell numbers positive for FK2, uH2A, and γH2AX were quantified from at least 3 different microscopic fields. The graph depicts percentage of cells positive for the indicated foci, and the error bars show the standard deviation. *Indicates P value 0.05 on Student t test.
