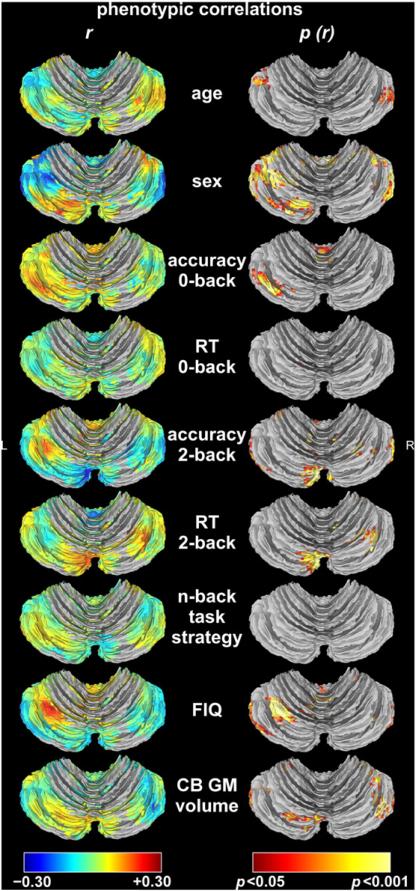
Fig. 4.
Phenotypic correlations with cerebellar activation. The first column shows the strength of the correlation (r). Positive correlations, i.e., greater activation in older participants, in males, in participants with higher task performance, slower response time (RT), with spatial task strategy as opposed to numerical task strategy, with higher full-scale intelligence quotient (FIQ), or larger cerebellar (CB) gray matter (GM) volumes, are represented by hot colors and negative correlations, i.e., greater activation in younger participants, in females, in participants with lower task performance, faster RT, with numerical as opposed to spatial task strategy, with lower FIQ, or smaller cerebellar GM volumes, are represented by cold colors. The second column shows height- (p < 0.05) and cluster-thresholded p-value maps corresponding to the correlations (p (r)). Based on the smoothness of the correlation maps, which was estimated at 5.79 × 4.45 × 4.09 mm for age, 7.16 × 4.76 × 3.92 mm for sex, 5.53 × 4.43 × 4.12 mm for RT on 0-back, 7.16 × 6.14 × 5.97 mm for RT on 2-back, 6.60 × 4.89 × 4.30 mm for accuracy on 0-back, 6.84 × 5.61 × 4.79 mm for accuracy on 2-back, 7.50 × 6.07 × 5.04 mm for FIQ, 6.39 × 6.35 × 5.86 mm for n-back task strategy, and 7.25 × 5.75 × 4.80 mm for cerebellar GM volume, Monte Carlo simulation determined a minimum cluster size of 167 voxels, 193 voxels, 161 voxels, 275 voxels, 194 voxels, 225 voxels, 258 voxels, 258 voxels, and 237 voxels, respectively, for FWE corrected cluster significance at p < 0.05. The phenotypic correlations between n-back task strategy (spatial relative to numerical) and cerebellar activation did not survive cluster thresholding.

