Figure 3.
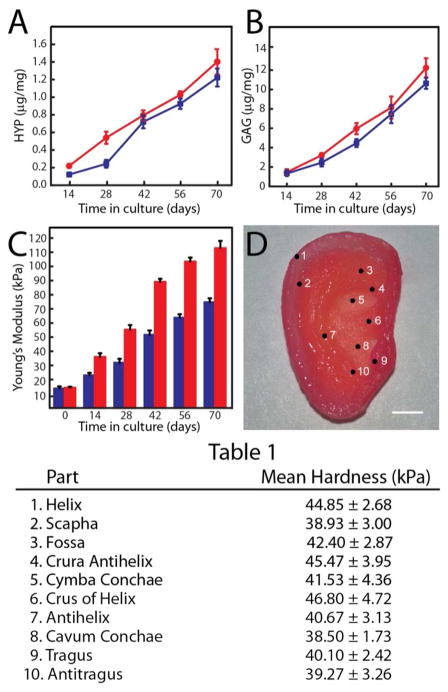
Biomechanical characterization of the 3D printed neocartilage tissue. (A) Variation of HYP content over time in culture with 20 % (red) and 10 % (blue) FBS. (B) Variation of GAG content over time in culture with 20 % (red) and 10 % (blue) FBS. (C) Variation of Young’s modulus of 3D printed dog bone constructs over time in culture with 20 million (blue) and 60 million (red) cells/mL. Error bars for parts A-C show standard deviation with N=3. (D) Various anatomic sites of the ear auricle, with corresponding hardness listed in Table 1. Scale bar is 1 cm.

