
Figure 4. miR-430 expression is regulated by Nanog.
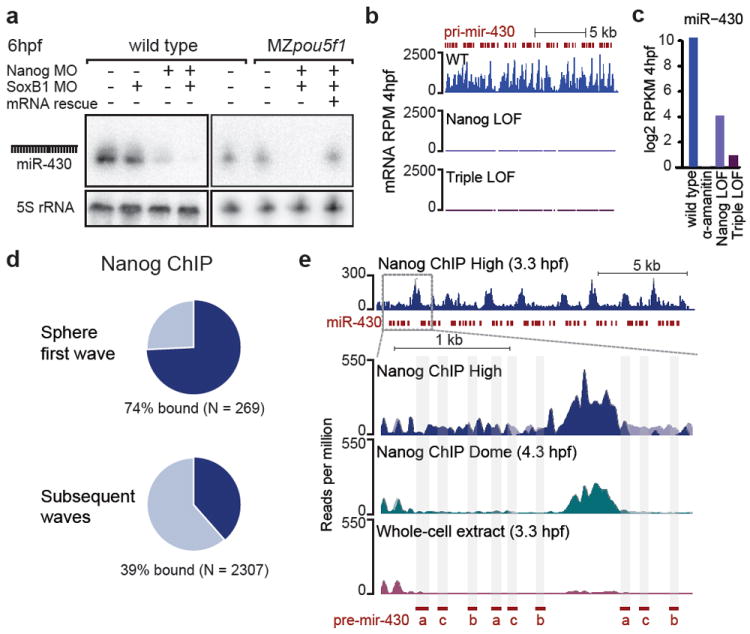
a. Northern blot shows miR-430 is severely reduced in Nanog LOF and nearly undetectable in the triple LOF b. RNA-Seq read levels of the pri-mir-430 polycistron in wild type and LOF. c. Bar plot of total miR-430 aligning reads. d. First-wave genes are highly bound by Nanog. e. Nanog binding across the miR-430 region (top panel) and a zoomed region where reads are preferentially aligned to the 5’ end. Binding profiles show a strong peak between two precursors. pre-miR-430a, b and c are marked in red.