
Figure 1.
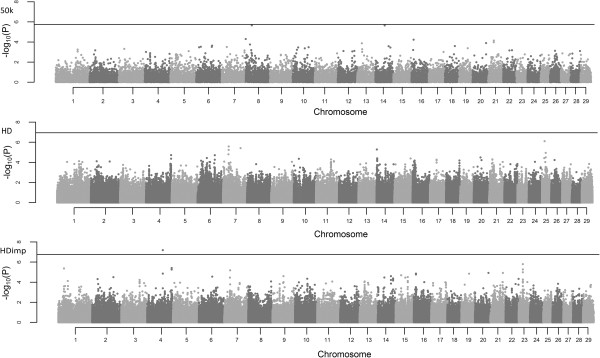
Manhattan plots of –Log10(P-values) for DMI in Nellore cattle. The horizontal lines represent the Bonferroni threshold (50 k = 1.77 × 10⁻⁶, HD = 1.15 × 10⁻⁷, HDimp = 1.72 × 10⁻⁷).
Official websites use .gov
A
.gov website belongs to an official
government organization in the United States.
Secure .gov websites use HTTPS
A lock (
) or https:// means you've safely
connected to the .gov website. Share sensitive
information only on official, secure websites.
Manhattan plots of –Log10(P-values) for DMI in Nellore cattle. The horizontal lines represent the Bonferroni threshold (50 k = 1.77 × 10⁻⁶, HD = 1.15 × 10⁻⁷, HDimp = 1.72 × 10⁻⁷).