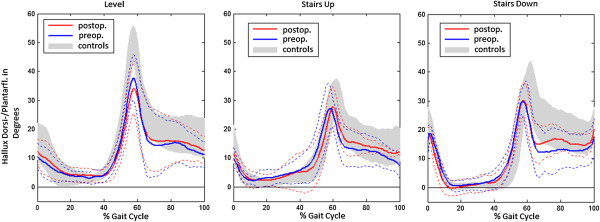
Figure 2.
Pre- and postoperative hallux dorsiflexion/plantarflexion. Pre- and postoperative hallux dorsiflexion/plantarflexion given as angles (in degrees) with time of the gait cycle (0-100%) for patients compared to the control participants in all gait conditions. Heavy lines: mean values, dashed lines: standard deviation. Positive values indicate dorsiflexion.

