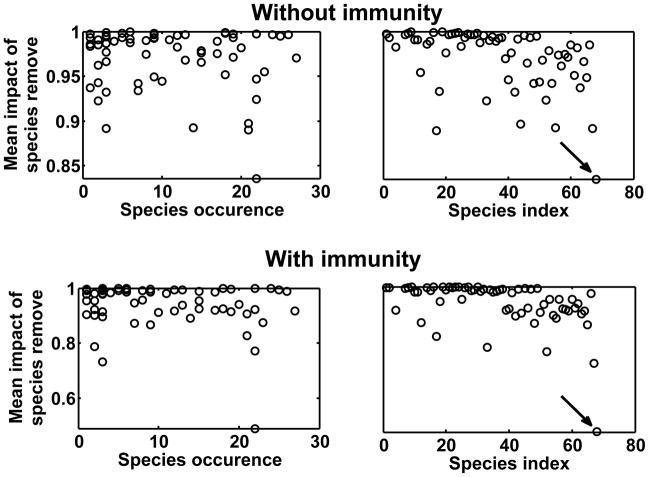
Figure 3.
Relationships between the “mean impact of taxon removal”, representing proportional decrease of disease prevalence across all communities, and (A,C) occurrence of host taxon (number of times where this taxon has been observed among the 27 aquatic communities) or (B,D) their identity. Arrows indicate the Oligochaeta taxon (see main text for further details).

