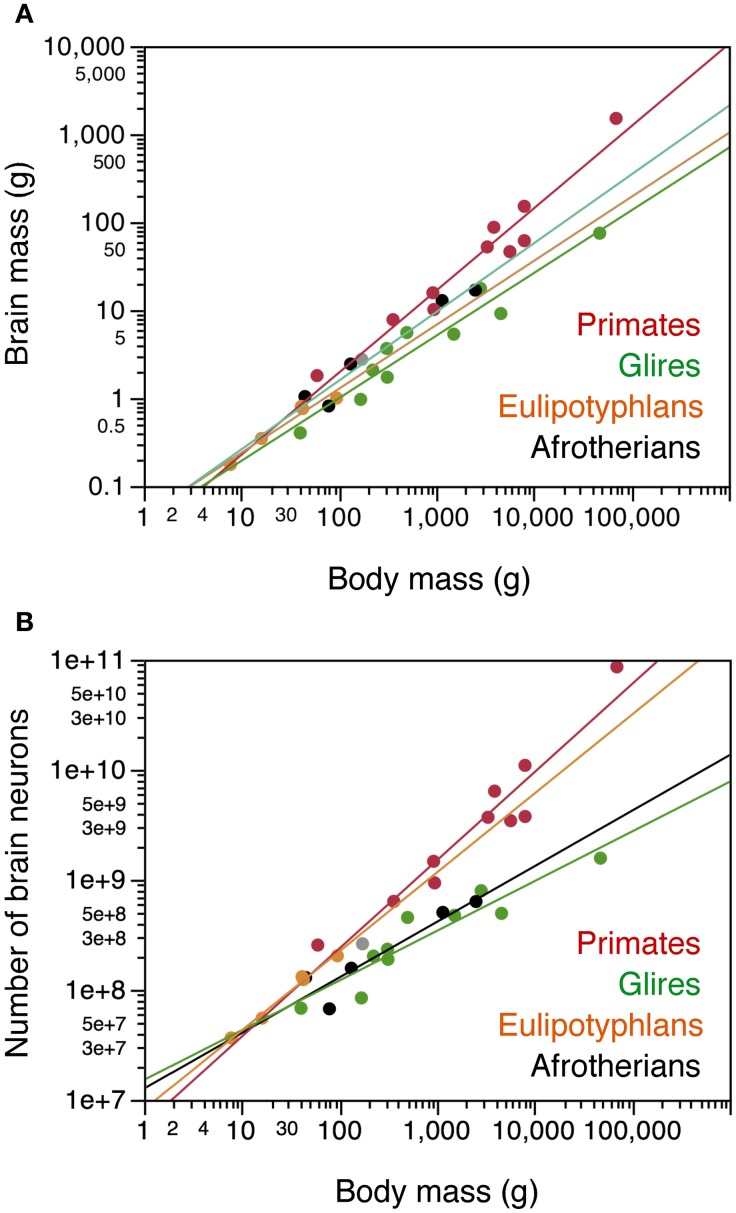
Figure 2.
Afrotherian brains gain mass similarly to Glires and eulipotyphlans, but gain neurons similarly to Glires and not to eulipotyphlans or primates. Scaling relationships for afrotherian brains (in black) are plotted along with rules found previously for other groups (primates in red, glires in green, eulipotyphlans in orange, scandentia in gray). Graphs relate (A) total brain mass (excluding the olfactory bulb) and (B) total numbers of neurons in the brain (excluding the olfactory bulb) to body mass. Each point represents the average values for each species. Data from Herculano-Houzel et al. (2006, 2007, 2011); Azevedo et al. (2009); Sarko et al. (2009); Gabi et al. (2010). Power functions for each group are plotted. Exponents for brain mass × body mass are 0.781 ± 0.101 (afrotherians), 0.712 ± 0.071 (Glires), 0.727 ± 0.094 (eulipotyphlans), 0.934 ± 0.068 (primates with Scandentia). Exponents relating number of brain neurons to body mass are 0.505 ± 0.113 (afrotherians), 0.451 ± 0.061 (Glires), 0.717 ± 0.045 (eulipotyphla), and 0.801 ± 0.084 (primates).

