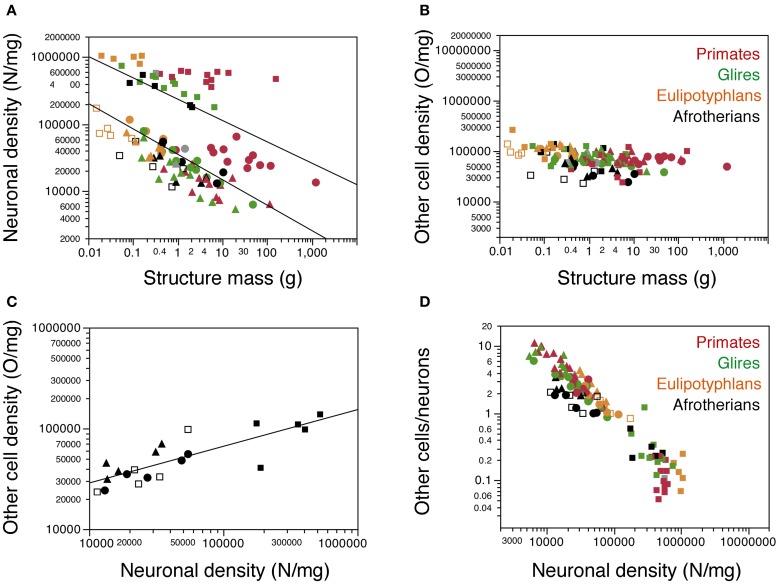
Figure 5.
Cellular density variation. (A, B) average neuronal density [in number of neurons per mg of tissue; (A)] and average density of other cells [in number of other cells per mg of tissue; (B)] are plotted for each structure in each species, with a similar Y-axis for comparison. Afrotherian species are plotted in black, glires in green, primates in red, scandentia in gray, and insectivores in orange. For clarity, only the significant power functions for afrotherians are plotted in (A) (cerebral cortex with hippocampus, exponent −0.378 ± 0.082; cerebellum, exponent −0.317 ± 0.070). No brain structure in no mammalian order examined here exhibits a significant correlation between other cell density and structure mass. (C) variation in other cell density plotted as a function of neuronal density for afrotherian brain structures only. The function plotted applies to the ensemble of all structures (exponent, 0.363 ± 0.060). (D) variation of the O/N ratio, that is, between numbers of other cells and numbers of neurons in each brain structure of each species, plotted as a function of neuronal density in the same structure. Filled circles, cerebral cortex (with hippocampus); open squares, hippocampus; filled squares, cerebellum; filled triangles, rest of brain. Data from Herculano-Houzel et al. (2006, 2007, 2011); Azevedo et al. (2009); Sarko et al. (2009); Gabi et al. (2010).

