Figure 3.
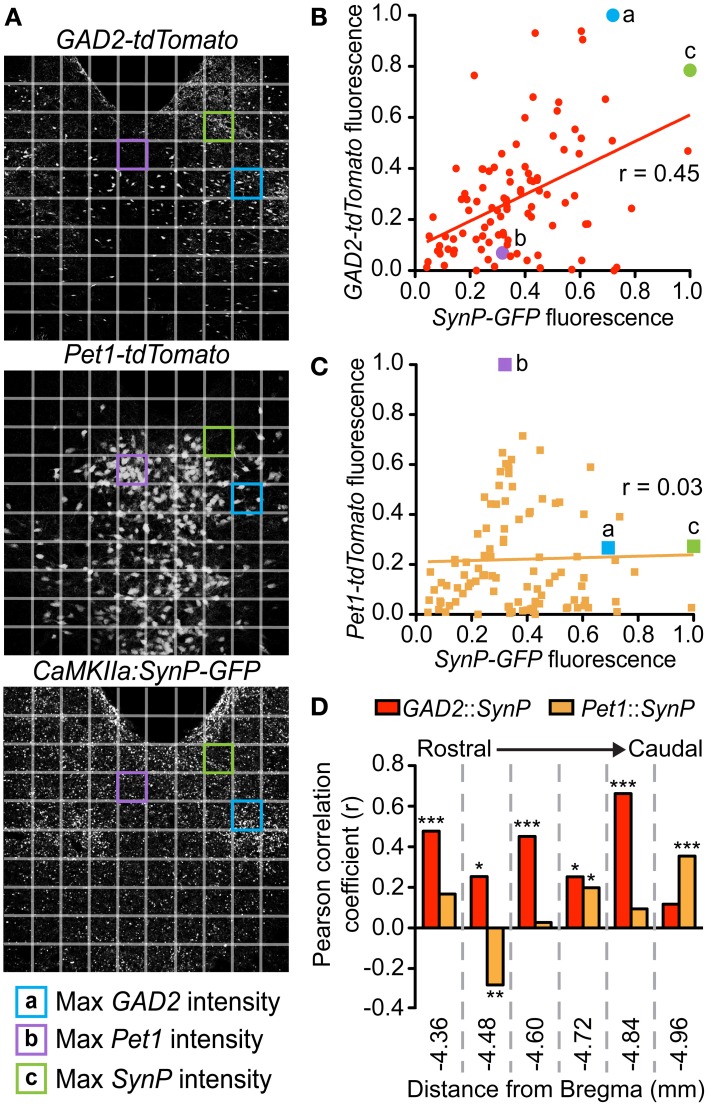
Topographic distribution of vmPFC terminals correlates with GABAergic populations in the DRN. At each of the 6 rostrocaudal levels of the DRN, images of each fluorescent signal were divided into a 10 × 10 grid. Relative intensities were calculated for each of the SynP-GFP (vmPFC terminals), GAD2-tdTomato (GABA neurons) and Pet1-tdTomato (5-HT neurons) fluorescent signals for each box of the grid at every rostrocaudal level. (A) For example, depicted here are DRN slices at −4.60 mm from Bregma. Highlighted grid boxes depict areas that were calculated to have the highest (a) GAD2-tdTomato intensity, (b) Pet1-tdTomato intensity and (c) SynP-GFP intensity. Intensity values of SynP-GFP were correlated with that of (B) GAD2-tdTomato or (C) Pet1-tdTomato at each of the 6 rostrocaudal levels. These were graphed on scatter plots with (x,y) coordinates plotted as (SynP-GFP intensity, tdTomato intensity). Grid boxes highlighted in (A) are plotted in (B) and (C) as examples. Pearson's correlation coefficients (r) were calculated for GAD2-tdTomato or Pet1-tdTomato vs. SynP-GFP with r = 1 signifying strong correlation, r = 0 signifying no correlation and r = −1 signifying strong negative correlation. (D) Overall there is a stronger correlation of topographic distribution of GABA neurons with vmPFC terminals than 5-HT neurons except in the most caudal DRN. (Bars with asterisks indicate Pearson coefficients that are significantly non-zero; *p < 0.05, **p < 0.005, ***p < 0.001).

