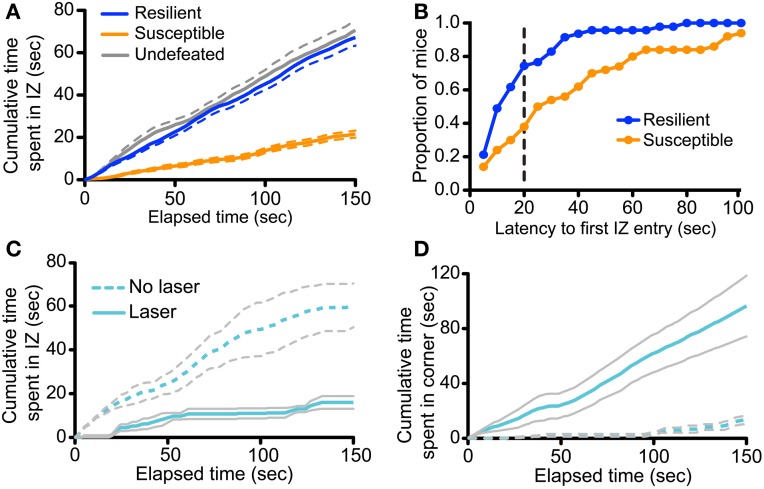
Figure 7.
Defeat and photoactivation of vmPFC terminals in the DRN bias social approach/avoidance choices. (A) Analysis was performed on 97 previously defeated and 20 undefeated mice. Defeated mice were characterized as resilient or susceptible based on previously described criteria (Golden et al., 2011; Challis et al., 2013). The cumulative time spent in the interaction zone (IZ) was plotted across the duration of the social interaction test. The cumulative interaction time of susceptible mice significantly diverged from that of both resilient and control mice at 4 s (Repeated measures ANOVA, Fisher post-hoc, p = 0.020 at 4 s). Data shown is average per group. Dashed lines represent the s.e.m. (B) Latencies to the first IZ entry were determined in 5-s bins. Plotted are the proportions of mice within each behavioral group to display first IZ entry within the given timeframe or less. A greater proportion of resilient mice first entered the IZ faster that of susceptible mice (Kolmogorov-Smirnov test, p < 0.001). The dashed vertical line represents the latency at which the proportion discrepancy between the two behavioral is the largest (0.36). (C) Cumulative time spent in the IZ is plotted across time in the social interaction test for undefeated CaMKIIa-Cre mice expressing ChR2 in the vmPFC with and without laser stimulation of vmPFC terminals in the DRN. Increase in cumulative interaction time from 0 s did not significantly differ until 60 s in laser-treated mice (Repeated measures ANOVA, Fisher post-hoc within Laser group, p = 0.045 at 60 s). (D) Cumulative time spent in the corners distal to the novel social target is plotted across time in the social interaction test. Increase in cumulative corner time from 0 s significantly differed at 14 s in laser-treated mice (Repeated measures ANOVA, Fisher post-hoc within Laser group, p = 0.047 at 14 s).

