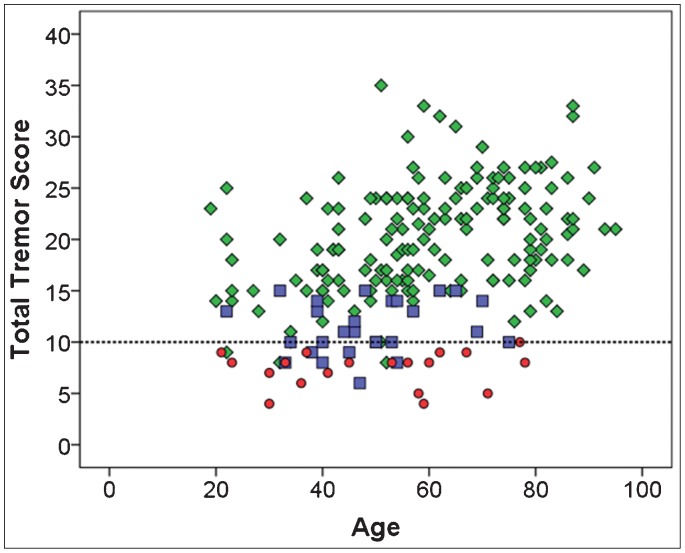
Figure 1. Total Tremor Score (y-Axis) by Age (x-Axis) Across the Three Diagnostic Groups.
Essential tremor (ET), green diamonds; borderline ET, blue squares, and normals, red circles. A total tremor score ≥10 (horizontal line) separated the borderline ET cases from normals with a sensitivity of 77.8% and a specificity of 94.7% (correct classification, 84.7%). One borderline ET did not have a total tremor score and two others had identical total tremor scores and ages.

