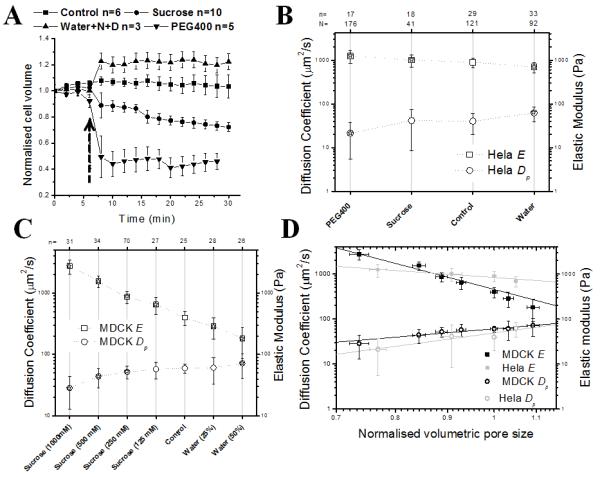
FIGURE 2. Poroelastic and elastic properties change in response to changes in cell volume.
In all graphs, error bars indicate the standard deviation and, in graphs B and C, asterisks indicate significant changes (p<0.01 compared to control). N indicates the total number of measurements and n indicates the number of cells. In hypoosmotic shock experiments, cells were incubated with NPPB and DCPIB (N+D on the graph), inhibitors of regulatory volume decrease. (A) Cell volume change over time in response to changes in extracellular osmolarity. The volume was normalized to the initial cell volume at t=0 s. The arrow indicates the time of addition of osmolytes. (B) Effect of osmotic treatments on the elasticity E (squares) and poroelastic diffusion constant Dp (circles) in HeLa cells. (C) Effect of osmotic treatments on the elasticity E (squares) and poroelastic diffusion constant Dp (circles) in MDCK cells. (D) Dp and E plotted as a function of the normalised volumetric pore size ψ~(V/V0)1/3 in log-log plots for MDCK cells (black squares and circles) and HeLa cells (grey squares and circles). Straight lines were fitted to the experimental data points weighted by the number of measurements to reveal the scaling of Dp and E with changes in volumetric pore size (grey lines for HeLa cells, E~ ψ−1.6 and Dp~ ψ2.9 and black lines for MDCK cells, E~ ψ−5.9and Dp~ ψ1.9).

