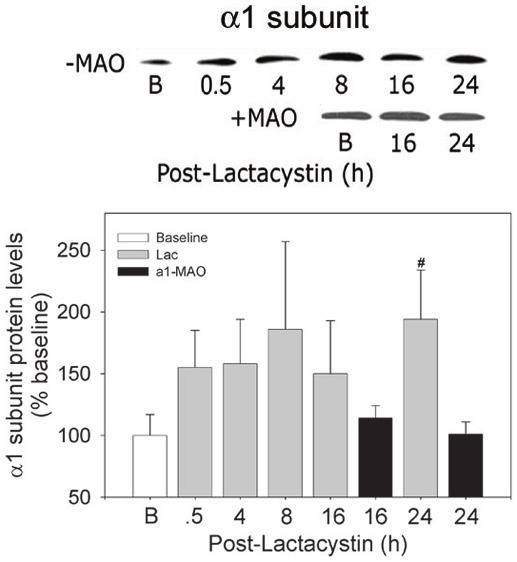
Figure 3.

Diminished α1 subunit expression following treatment of cardiomyocytes with antisense oligonucleotides. RNVCs were pulse-treated with Lac, 5 µmol/L, for 30 min, and then maintained in culture for up to 24 h. In a separate set of experiments, RNVCs were pulse-treated with Lac, 5 µmol/l, for 30 min after which the cells were incubated with α1-MAO for 16 and 24 h. At the indicated time points, RNVCs were harvested and protein levels of the α1 subunit determined using immunoblot techniques. Top panel, composite depicting changes in α1 protein levels in the absence (-MAO) and presence (+MAO) of the antisense oligonucleotide. Bottom panel, densitometry of α1 subunit protein. The depicted membranes are representative of 3 to 4 separate experiments. The values are expressed as the percent of the baseline values and are expressed as the mean ± SEM of 3 to 4 separate experiments. #P<0.05 (ANOVA) when compared with baseline and corresponding + α1-MAO values.
