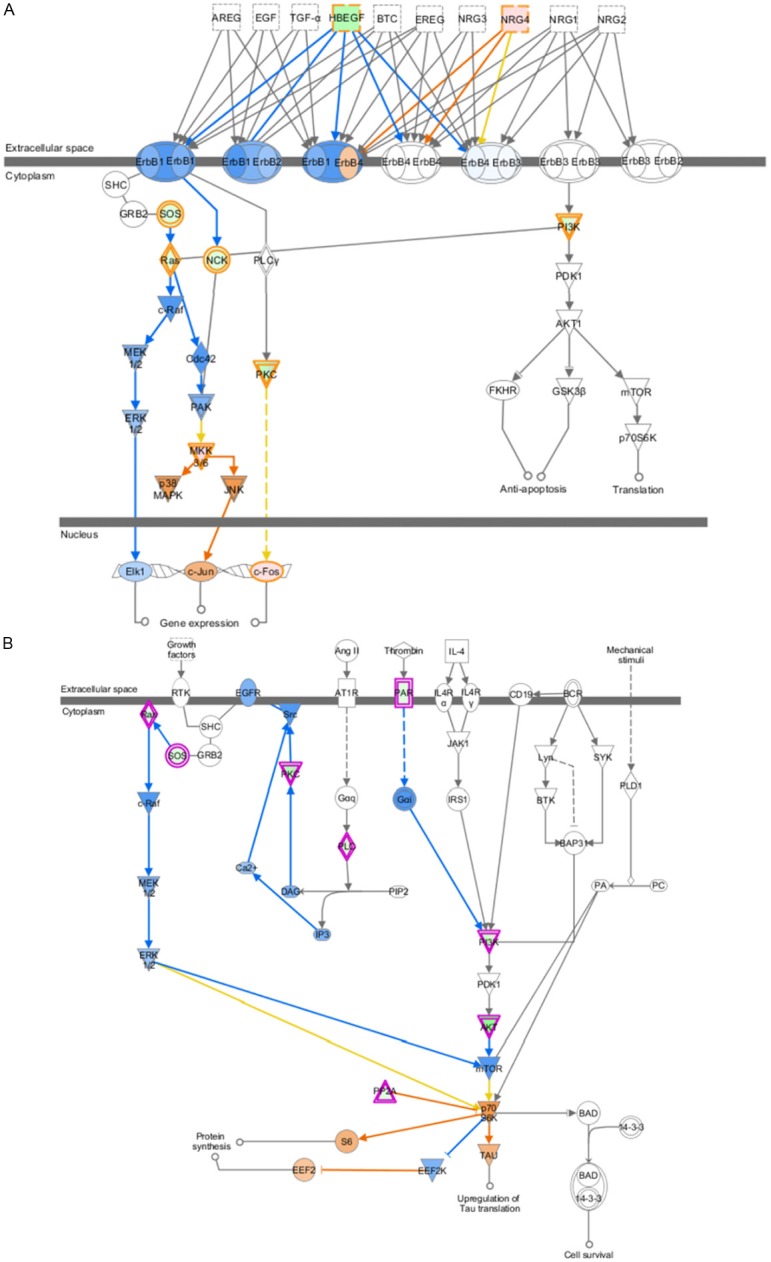
Figure 3.

The predicted EGFR signaling and p70S6K signaling in Gem-resistant GBC cell line were shown. The prediction was based on the expression of associated genes in DNA microarray data. The orange circle and arrow represent “induce”, while the blue circle and arrow represent “inhibit”. A: EGFR signaling in Gem-resistant GBC cell line. B: p70S6K signaling in Gem-resistant GBC cell line.
