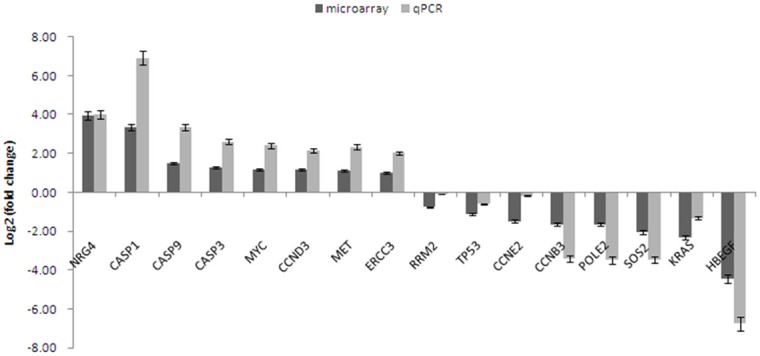
Figure 4.

qPCR validation for microarray data. The fold change of expression in Gem-resistant GBC cell line (SGC-996) was calculated relative to Gem-sensitive cell line (GBC-SD), the error bar represents the standard deviation (SD). The fold change was log2 transformed, so the gene whose value of log2 (fold change) was higher than zero, was highly expressed in Gem-resistant GBC cell line.
