
Figure 3.
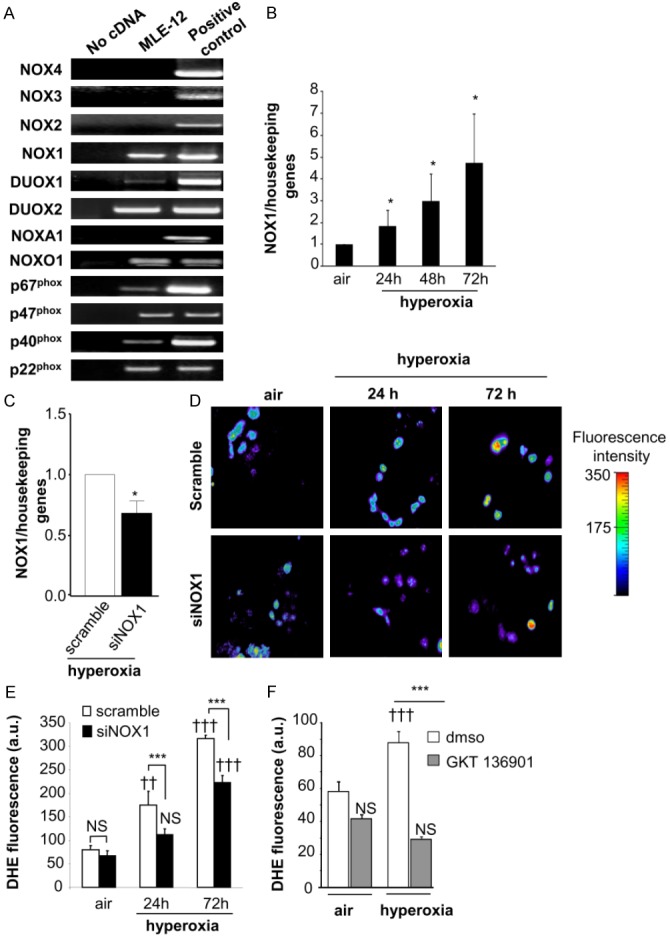
Hyperoxia increases NOX1 mRNA expression and ROS-dependent NOX1 production in MLE12. (A) Expression of NOX isoforms in MLE12. NOX1, DUOX1/2, and the regulatory subunits p22phox, p40phox, p67phox and NOXO1 were detected in MLE12 by RT-PCR. Lung tissues were used as positive control for the detection of NOX1, 2, 4, DUOX1/2, and the regulatory subunits. For the detection of NOX3 mRNA expression, ear tissue was used as positive control. Absence of cDNA was used as negative control for expression of NOX1 mRNA in MLE12 measured by real time PCR in air condition and (B) at 24, 48 and 72 h following hyperoxia exposure (n=3). *P<0.05. (C) NOX1 mRNA measured by qualitative RT-PCR in scramble- and NOX1-silenced MLE12 (siNOX1) at 72 h of hyperoxia. (D, E) Representative fluorescent images of scramble- and NOX1-silenced MLE12 loaded with DHE. ROS production was measured by analysing DHE staining (10 M) in scramble- and NOX1-silenced MLE12 in air or hyperoxia for 24 and 72 h, and visualized by confocal microscopy (pseudocolor). Original magnification, X40. Fluorescence intensity was quantified in MLE12, bars represent the mean ± SEM (n>50 cells for each group; P=NS, ***P<0.001, scramble-versus NOX1-silenced cells under hyperoxia; ††P<0.01, †††P<0.001, air versus hyperoxia). (F) Acute inhibition of NOX1 prevents hyperoxia-induced ROS production. MLE12 were treated with dmso, or GKT136901 (10 μm) 1 hour before hyperoxia exposure and for 72 h. ROS generation was measured by analysing DHE fluorescence intensity in treated MLE12 exposed to air or hyperoxia for 72 h. Bars represent the mean ± SEM (n>50 cells for each group; ***P<0.001 cells treated with NOX inhibitor compared to cells treated with DMSO exposed to hyperoxia; P=NS, †††P<0.001, air versus hyperoxia).