
Figure 2.
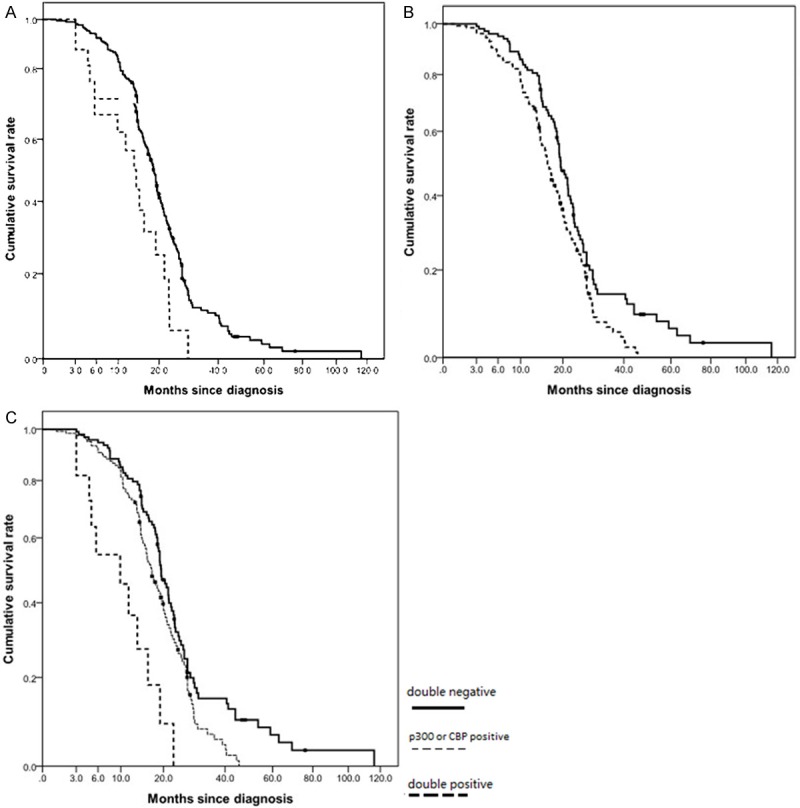
Kaplan-Meier cumulative survival analyses for 220 SCLC patients with different p300, CBP and MLL status. A: Difference in overall survival for negative p300 expression and positive p300 expression was statistically by Log-rank (P = 0.01). Solid black line, patients in negative p300 expression; dashed black line, patients in positive p300 expression. B: Difference in overall survival for negative CBP expression and positive CBP expression was statistically by Log-rank (P = 0.005). Solid black line, patients in negative CBP expression; dashed black line, patients in positive CBP expression. C: Patients were divided into three groups according to p300 expression (positive or negative) and CBP expression (positive or negative); (-): double negative, (+): p300 or CBP positive, (++): double positive. The double-positive group had a significantly poor overall survival and the double-negative group had the best overall survival (p < 0.001).