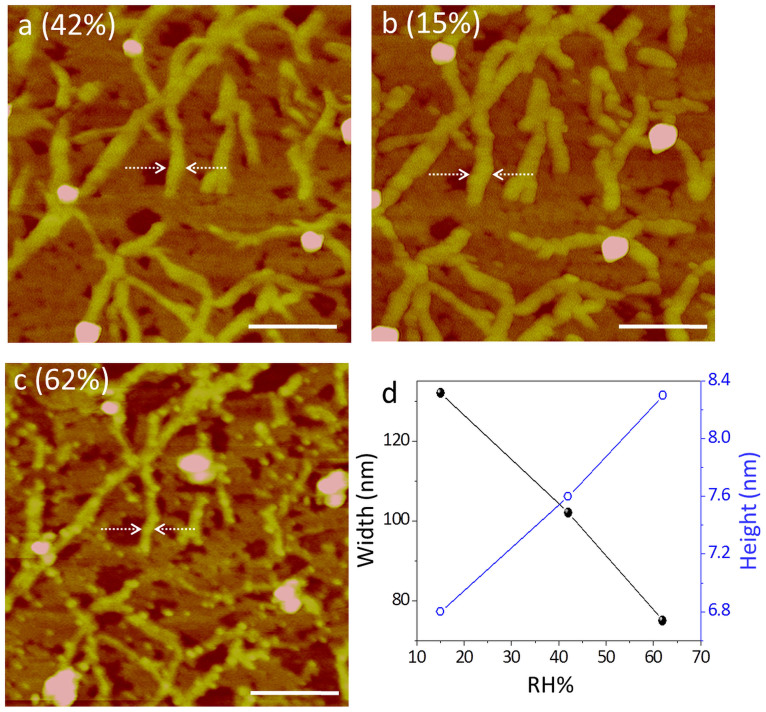
Figure 5. AFM analysis of nanofibres under different RH conditions.
AFM images of CS-DMV nanofibres acquired at ambient RH of 42% (a) followed by at 15% (b) and 62% (c), the last two measurements being carried out in atmospheric hood. Scale bar: 500 nm, z scale: 20 nm. (d). The variations in width (left) and height (right) of nanofibre marked in dotted lines with different RH conditions. Data from other regions are presented in the Supplementary Fig. S4.

