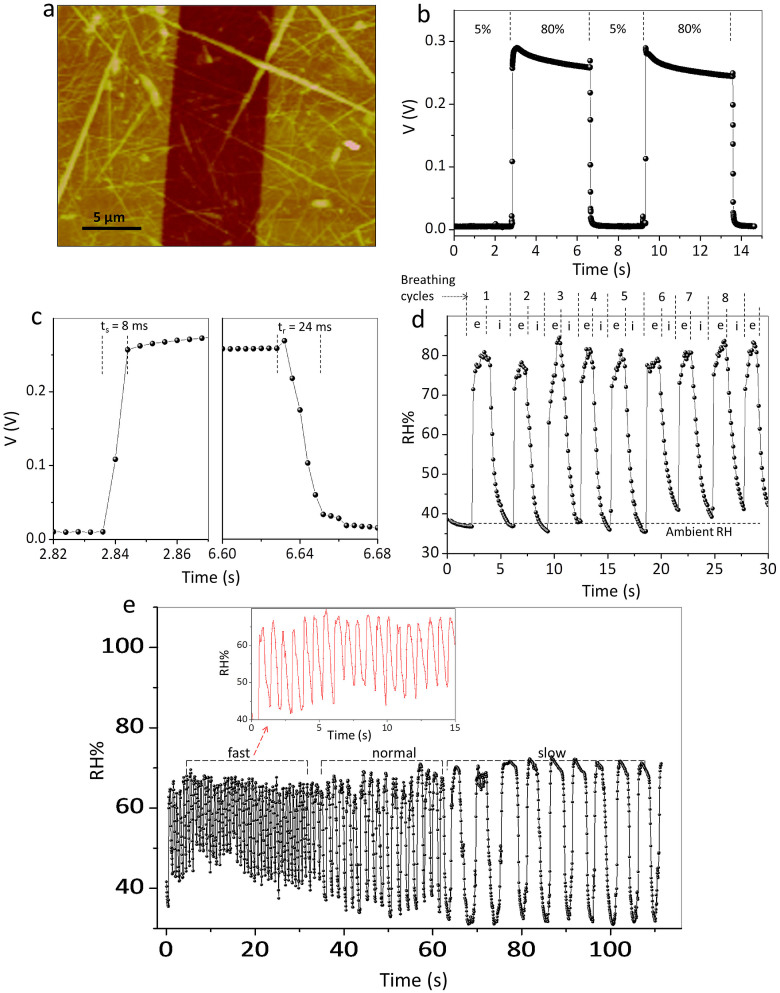
Figure 7. A breath RH sensor.
(a) Tapping mode AFM images of few nanofibres across gold electrodes (≈8 μm). The z scale in the image is 20 nm. (b) The changes in output voltage measured using an oscilloscope, from a few nanofibre sensor as RH is switched between 5% and 80%. (c) Estimation of response and recovery times of the sensor. (d) Variations in the RH of the exhaled breath of a healthy person. e and i refer to the exhaling and inhaling respectively. (e) Response of the sensor at different breathing rates. Inset shows zoom in part of the response corresponding to fast breathing.

