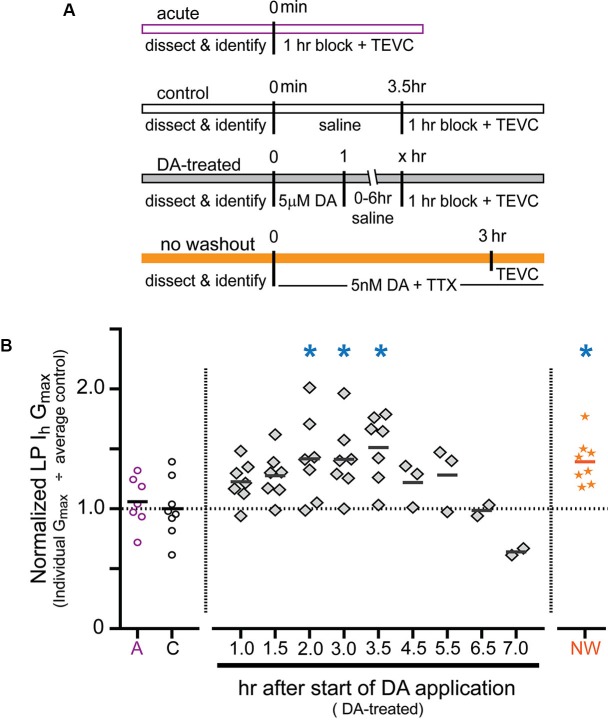
Figure 2.
Time course for the persistent increase in LP IhGmax. (A) Diagram of the experimental protocol for each of the four treatment groups. For all treatment groups a single measure was obtained for each preparation using two-electrode voltage clamp (TEVC) at the end of the experiment, i.e., LP Ih was not repeatedly measured over time within a given preparation; rather, terminal measurements from DA-treated preparations were compared to terminal measurements from control preparations and 68 animals were used for all of the experiments shown. Note that for the DA-treated group, the length of the saline wash varied across time points. (B) Plot of normalized LP Ih Gmax for each experiment in every treatment group. Each symbol is a discrete experiment; e.g., the preparations in the 1 h DA-treatment group are different from the preparations in the 1.5 h DA-treatment group. Each y-value represents the LP Ih Gmax for that experiment divided by the mean for the control experiments. The solid horizontal lines represent the means. Note that means will not be accurate at later time points where n ≤ 3, and they are only meant to show a decreasing trend over time. The numbers on the x-axis correspond to the hours that elapsed between the beginning of the DA application and the beginning of the block, i.e., x = 1 means that there was no saline wash before application of blocking saline; x = 2 indicates a 1 h saline wash, etc. Blue asterisks indicate significant differences relative to the control group as determined with a one-way ANOVA followed by Dunnett’s post hoc tests that compared the control treatment group to the acute and no washout treatment groups and each time point in the DA-treated group except those time points with n ≤ 3: F(7,50) = 3.921, p = 0.0018.

