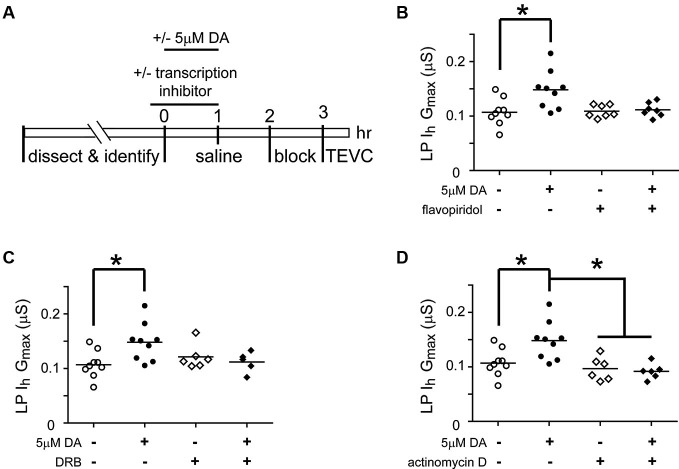
Figure 6.
Transcription is required for the DA- and activity-dependent persistent increase in LP IhGmax. (A) Diagram of the experimental protocol. (B) Flavopiridol (100 nM) blocks the persistent increase in LP Ih Gmax elicited by 5 µM DA. LP Ih Gmax is plotted for each treatment group; each symbol is one experiment; the horizontal bars represent the means. Asterisk indicates a significant difference as determined using t-tests to compare DA and saline treatment groups in preparations with (p = 0.701) and without (p = 0.011) flavopiridol. Note that an ANOVA could not be performed due to unequal variances between +/− flavopiridol groups (F-test, p < 0.03). (C) DRB (100 µM) blocks the persistent increase in LP Ih Gmax elicited by 5 µM DA. Asterisk indicates a significant difference as determined using a one-way ANOVA with Tukey’s post hoc tests that made all pairwise comparisons, F(3, 25) = 3.827, p < 0.022. (D) Actinomycin D (50 µM) blocks the persistent increase in LP Ih Gmax elicited by 5 µM DA but has no effect alone. Asterisks indicate significant differences as determined using a one-way ANOVA with Tukey’s post hoc tests that made all pairwise comparisons, F(3, 26) = 7.611, p = 0.0008.

