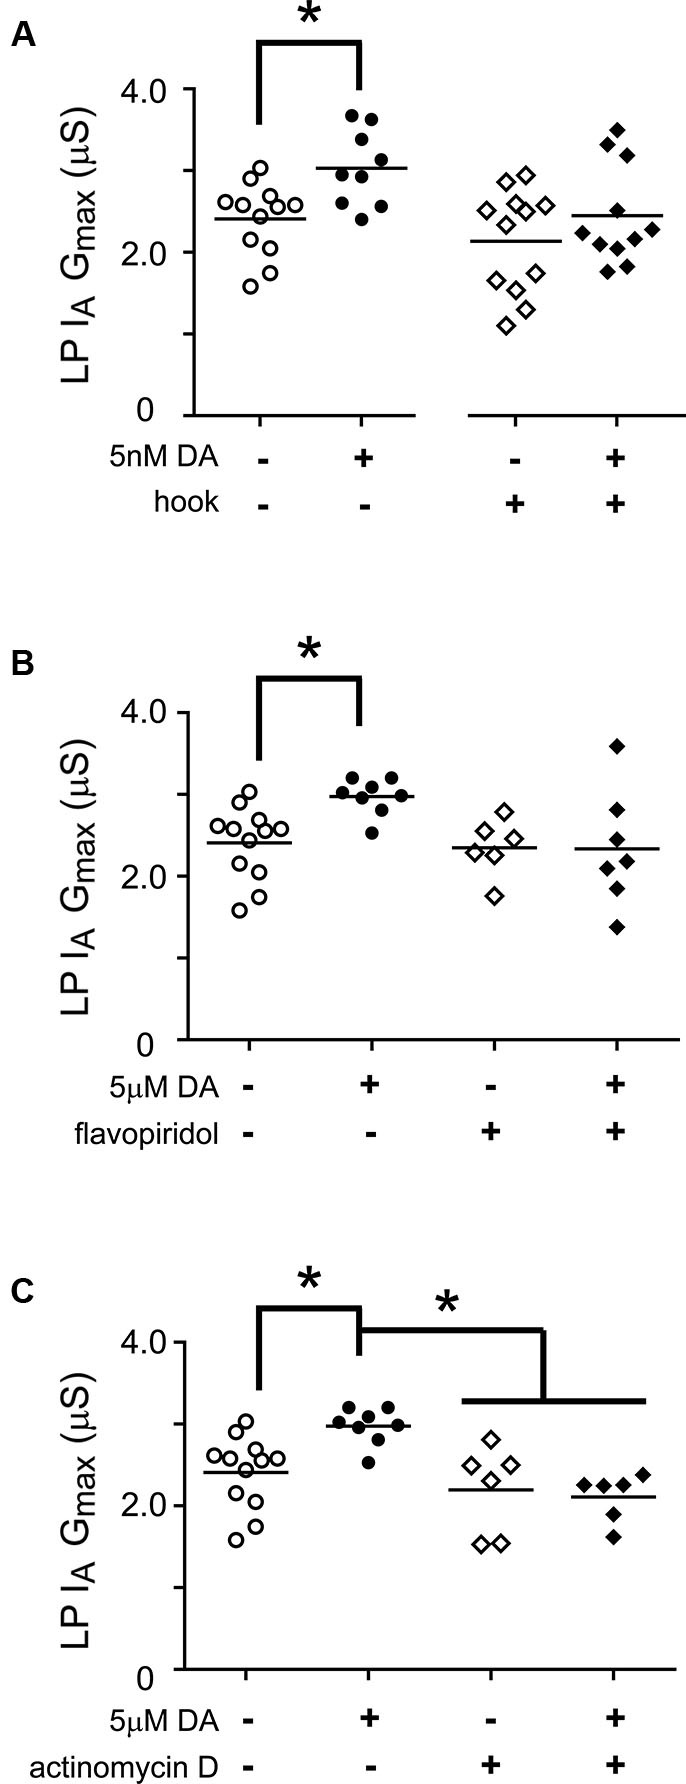
Figure 7.

miR transcription is required for the DA-dependent persistent increase in LP IhGmax. (A) The Ago hook blocks the persistent increase in LP IA Gmax elicited by 5 nM DA. The Ago hook injection experiments described in Figure 5A were repeated without TTX, and LP IA Gmax was measured. Each symbol represents one experiment, and the horizontal bars represent the means. The asterisk indicates a significant difference between the saline and DA-treated preparations, as determined using Student t-tests for the non-injected preparations (p < 0.006) and the hook-injected preparations (p = 0.244). (B) Flavopiridol (100 nM) blocked the persistent increase in LP IA Gmax elicited by 5 µM DA. Experiments diagrammed in Figure 6A were repeated with flavopiridol except that LP IA was measured and plotted for each treatment group. Each symbol is one experiment; horizontal bars are the means. Asterisk indicates a significant difference as determined using t-tests to compare DA and saline treatment groups in preparations with (p = 0.969) and without (p = 0.004) flavopiridol. Note that unequal variances between +/− flavopiridol groups prevented analysis with an ANOVA (F-test, p < 0.008). (C) Actinomycin D (50 µM) blocked the persistent increase in LP IA Gmax elicited by 5 µM DA. Experiments diagrammed in Figure 6A were repeated with Actinomycin D, except that LP IA was measured and plotted for each treatment group. Each symbol is one experiment; horizontal bars are the means. Asterisks indicate significant differences as determined using a Kruskal-Wallis test with Dunn’s multiple comparison posthoc tests, p = 0.0014.
