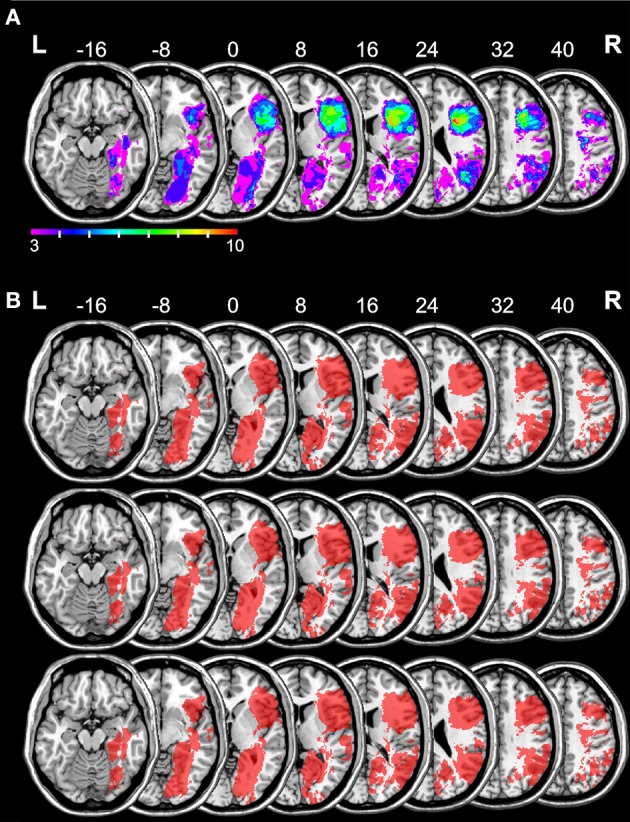
Figure 2.

Overlay lesion plot of all 32 patients and the results of the retrospective power analyses for each of the three LCT composite scores. The number of overlapping lesions (A) is illustrated by color, from violet (N = 3) to red (N = 10). Maximum overlap occurred in the right frontal lobe. The results of the power analyses (B) are shown in red [top row: LCT global composite, middle row: LCT constructive plan composite, bottom row: LCT behavioral (dis) organization composite]. These power maps demonstrate that in all areas where the lesions of at least three patients overlapped, we had sufficient power to potentially detect a significant difference between the behavioral scores of patients with a lesion and the behavioral scores of patients without a lesion. Numbers indicate MNI z-coordinates.
