
Figure 7.
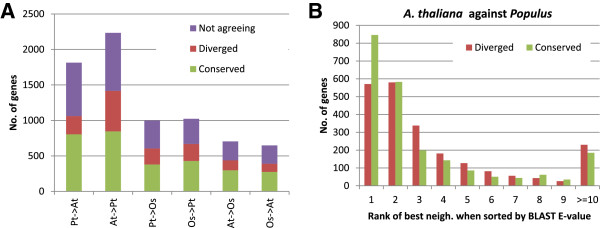
Network neighbourhood scores versus sequence similarity. (A) In each comparison X ─ > Y, we only consider the subsets of genes in X with at least one conserved and at least one diverged ortholog-neighbourhood in Y (blue parts of the bars in Figure 6). These genes are divided into genes where the most sequence similar ortholog also has the most conserved neighbourhood (Conserved), the most diverged neighbourhood (Diverged) or neither (Not agreeing). (B) A closer look at the ranks of the most significant ortholog-neighbourhood when sorted by sequence similarity.