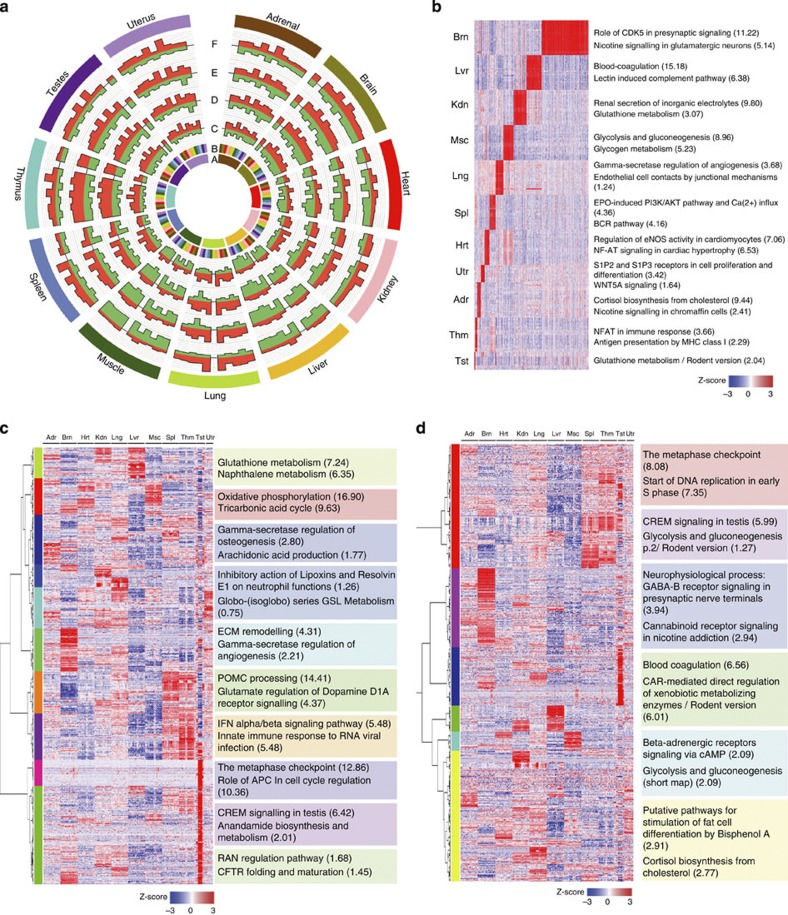
Figure 2. Organ- and development-dependent and sex-specific genes.
(a) Comparison of relative gene expression between organs. Circos plot illustrating the relative number of DEGs between any two organs (orange, overexpressed; green, underexpressed). Concentric circles from inside to outside represent; A, organ under comparison (colour-coded as described in the outer-most ring); B, the 11 organs being compared with organ A (note no change in DEGs for organ compared with itself); C–F, total number of DEGs, more (orange) or fewer (green) in organ A versus the other organs at weeks 2 (C), 6 (D), 21 (E) or 104 (F). Each bar represents the combination of either four or eight biological replicates for a given organ at the same developmental stage. A gene was considered differentially expressed between two organs if the fold change was  2 or
2 or  0.5 (t-test, P-value
  0.05). (b) Expression profiles of organ-enriched genes with corresponding significantly and uniquely enriched GeneGo canonical pathway maps. Expression data for 3,413 organ-enriched genes across 320 samples were arranged by organ type (in decreasing order in terms of the number of organ-enriched genes), sex and developmental stage. (c) Development-dependent clusters with significantly enriched GeneGo canonical pathway maps. Development-dependent genes in each organ were identified using a combination of ANOVA with Bonferroni-corrected P
 0.05 plus a FC
 2. Hierarchical clustering analysis grouped the development-dependent genes into 10 clusters. (d) Sex-specific clusters with significantly enriched GeneGo canonical pathway maps. The 288 samples (except uterus and testis samples) were separated into 36 groups based on four developmental stages and nine organ types. For any organ at any development stage, genes with a FC
 2 (or
2 (or  0.5) and P
 0.05 between female and male were considered sex-specific. Hierarchical clustering analysis grouped the sex-specific genes into six clusters. Expression data were Z-score standardized (mean zero and s.d. of one) per gene. Ontology terms of enriched GeneGo canonical pathway maps were listed next to each organ type (b) or cluster (c,d) on the right along with –log10(FDR q-value) in the parentheses. Organs tested are: Adr, adrenal; Brn, brain; Hrt, heart; Kdn, kidney; Lng, lung; Lvr, liver; Msc, skeletal muscle; Spl, spleen; Thm, thymus; Tst, testis; and Utr, uterus.

