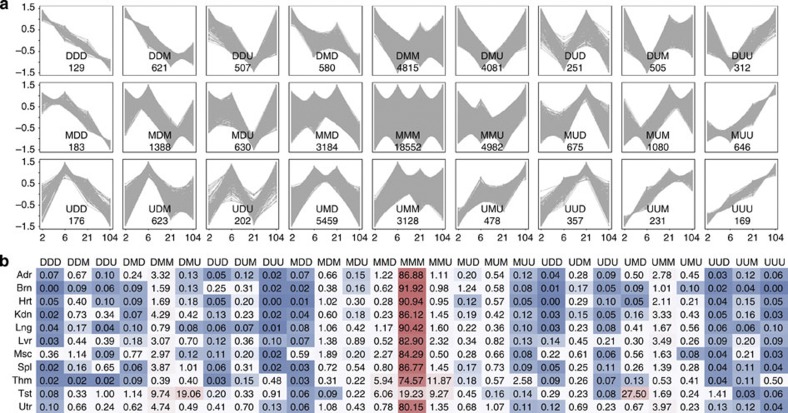
Figure 3. Development-dependent patterns of rat gene expression.
(a) Differentially expressed genes were determined based on a combination of ANOVA with the Bonferroni-corrected P-value  0.05 and FC
 2 (or
2 (or  0.5) between the four developmental stages. For each organ, data from two sequential developmental stages were compared, with the younger developmental stage used as the denominator. Genes were grouped into Up (U; ‘upregulated’ based on FC
 2), Down (D; ‘downregulated’ based on FC
 0.5), or Maintain (M; ‘no change’ based on 0.5<FC<2). Shown here are the 27 possible combinatorial patterns. The x axis depicts time point (in weeks) and the y axis depicts fold change. The number shown in each box (for example, 129 genes for pattern DDD) was derived based on the number of genes, across all 11 organs—where each gene was counted only once regardless of how many organs shared that same pattern. (b) The percentage of genes within each pattern per organ exhibiting specific development-dependent expression patterns. The numbers in the table are colour-coded; red indicates a relatively large percentage of genes with that expression pattern and blue represents a relatively small percentage of genes with that pattern. Organs tested are: Adr, adrenal; Brn, brain; Hrt, heart; Kdn, kidney; Lng, lung; Lvr, liver; Msc, skeletal muscle; Spl, spleen; Thm, thymus; Tst, testis; and Utr, uterus.

