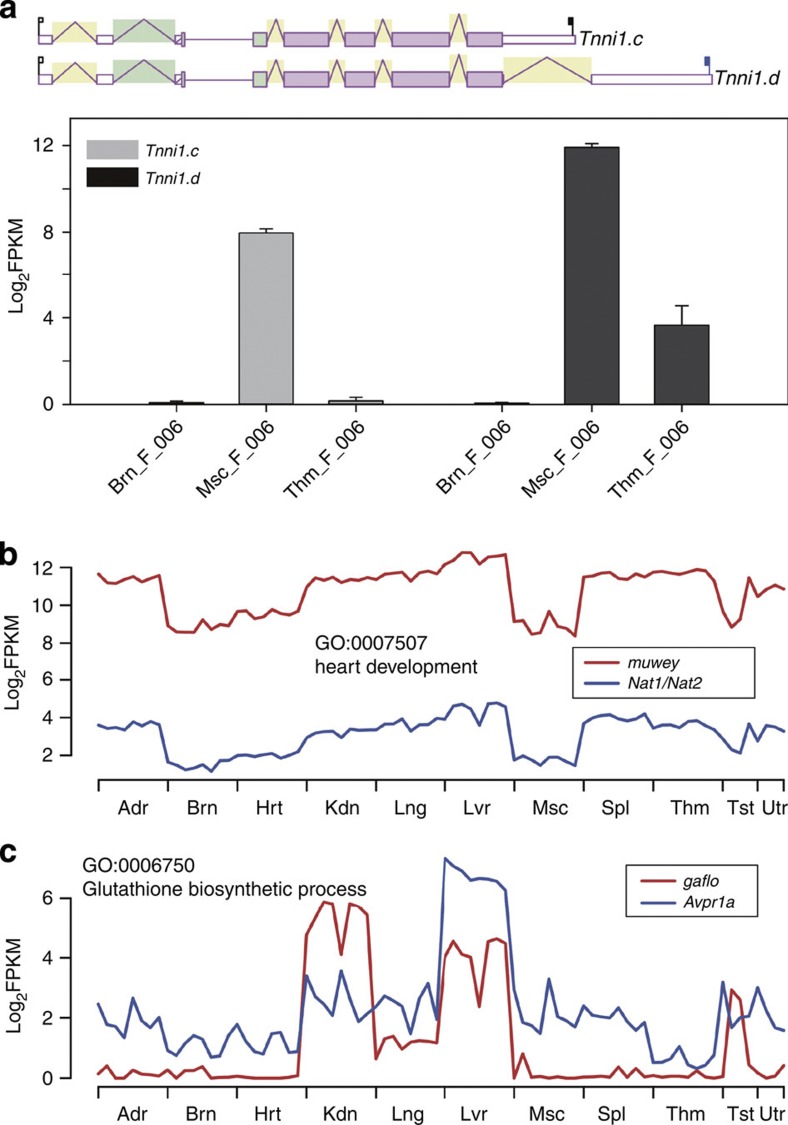
Figure 6. Alternative polyadenylation variants.
(a) An example of alternative splicing and polyadenylation. The upper panel of (a) shows the alternate variants c and d of gene Tnni1, both encoding the same protein isoform of troponin 1, skeletal, slow 1. A white thin box represents a UTR, whereas pink means a protein-coding region, and the solid black and blue flags in the 3′-UTRs represent the canonical and non-canonical poly-A signals used for polyadenylation, respectively. The expression levels of these two transcripts in brain (Brn), skeletal muscle (Msc) and thymus (Thm) of female (F) rats at week 6 (006) are shown in barplots, with error bars representing the s.e. of expression values (log2FPKM) across the four biological replicates. (b,c) Two examples of co-expression-based functional prediction. Each example includes the expression values (log2FPKM) of two genes, one with annotated functions (blue) and the other without (red) across the 80 sample groups ordered first by organ, then by sex (except for testis and uterus) and at last by age. The GO term shown for each example represents the function of the annotated gene (Nat1/Nat2 or Avpr1a) and is the predicted function of the corresponding non-annotated gene (spliced non-coding gene muwey or spliced coding gene gaflo). Organs tested are: Adr, adrenal; Brn, brain; Hrt, heart; Kdn, kidney; Lng, lung; Lvr, liver; Msc, skeletal muscle; Spl, spleen; Thm, thymus; Tst, testis; and Utr, uterus.

