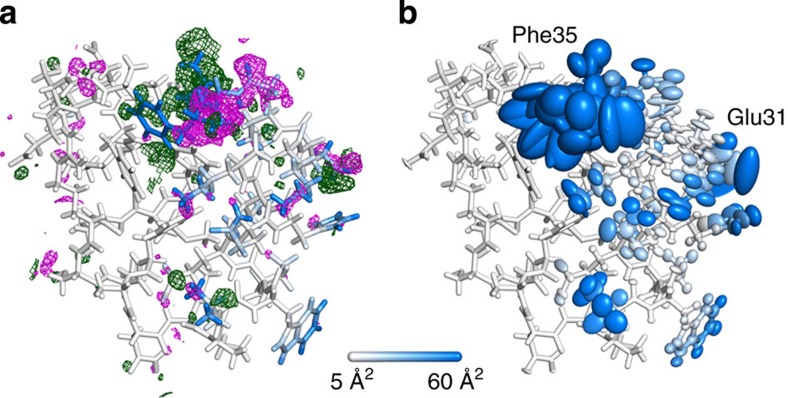
Figure 4. Final refined model and its electron density difference map.
Refined electron density difference map (Fo−Fc) and its accompanying structural model (a) for the restrained anisotropic refinement solved by molecular replacement using the simulation starting structure as the initial model. The same final model with its anisotropic ellipsoids is also displayed (b). The electron density maps have been calculated by CCP4 programs fft67 and mapmask, contoured at 3σ and displayed with a cutoff of 2 Å from each atom. The negative density is shown in magenta and the positive one in green. Each atom has been coloured by the simulated B-factor associated with it (the scale changes continuously from white to blue with cutoffs at 5 and 60 Å2).

