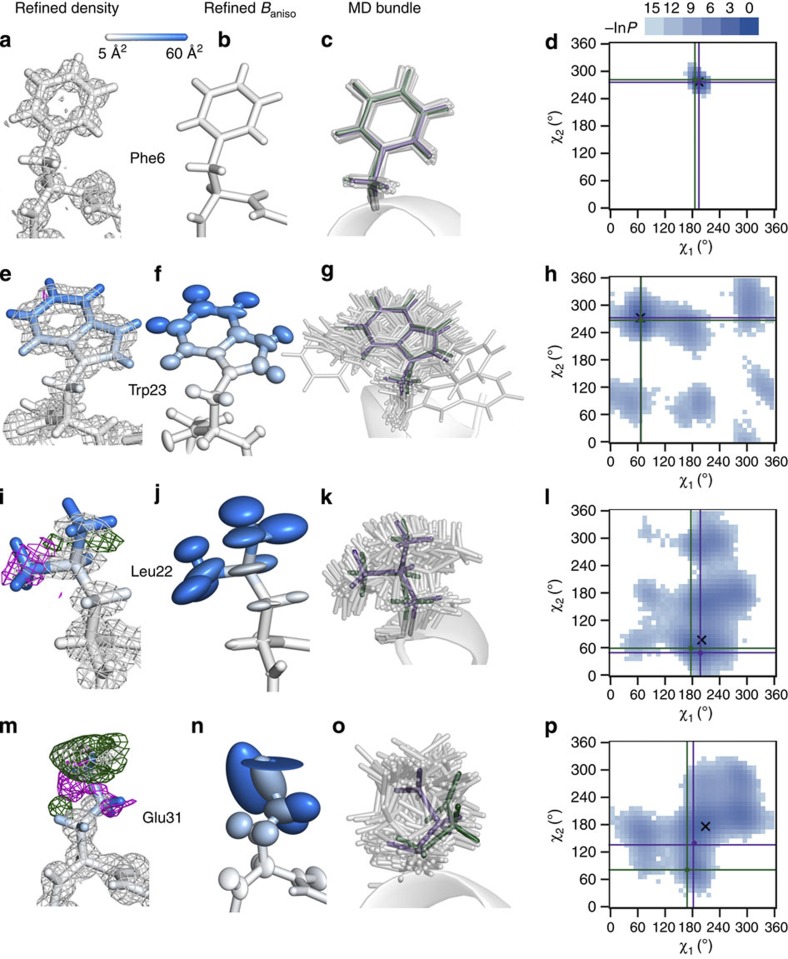
Figure 5. Electron density maps of selected residues and their heterogeneity.
Selected residues and their refined electron density maps (2Fo−Fc) are shown together with their difference maps (Fo−Fc) (a,e,i,m) for the geometrically restrained refinement that used the starting structure from simulation as a model for molecular replacement and anisotropic refinement of B-factors (shown with the ellipsoids—b,f,j,n): Phe6 (a–d), Trp23 (e–h), Leu22 (i–l), and Glu31 (m–p). 2Fo−Fc electron density maps have been contoured at 1σ and the Fo−Fc difference map at 3σ with negative densities shown in magenta and positive ones in green. Both maps are displayed with a cutoff of 2 Å from each atom. All atoms are coloured by the simulated B-factor associated with them (the scale changes continuously from white to blue with cutoffs at 5 and 60 Å2). In addition, a bundle of residues from 100 randomly chosen simulated structures is shown (grey), together with the residues from the final refined model (purple) and the starting model (green) (c,g,k,o). Only the backbone of the starting model is shown for clarity. Furthermore, statistical free energy profile of χ1 and χ2 dihedral angles (F=−RTlnP, where P is probability) calculated from the simulation is displayed for each residue as a histogram (bin size=10°, legend given in units of RT) with the angles from the final refined and the starting experimental model labelled as purple and green points, respectively, and emphasized with vertical and horizontal lines of the same colours (d,h,l,p). The angles from the average structure calculated from the simulation are shown as a black X.

