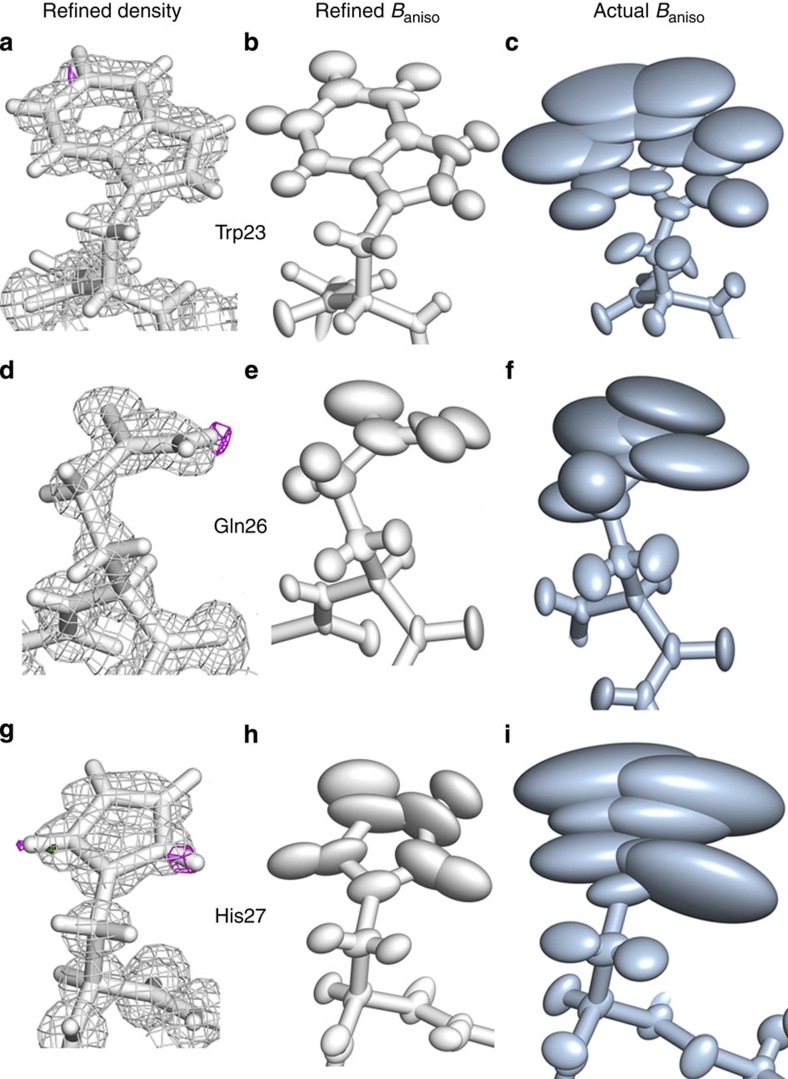
Figure 6. Comparison of the refined anisotropic thermal fluctuations with the actual simulated ones.
The final model obtained by molecular-replacement-based, restrained, anisotropic refinement is shown in white with its electron density (a,d,g) and anisotropic B-factor ellipsoids (b,e,h), while the actual simulated average structure with its anisotropic B-factor ellipsoids is shown in slate (c,f,i). All the residues are shown from the same perspective: Trp23 (a–c), Gln26 (d–f), and His27 (g–i).

