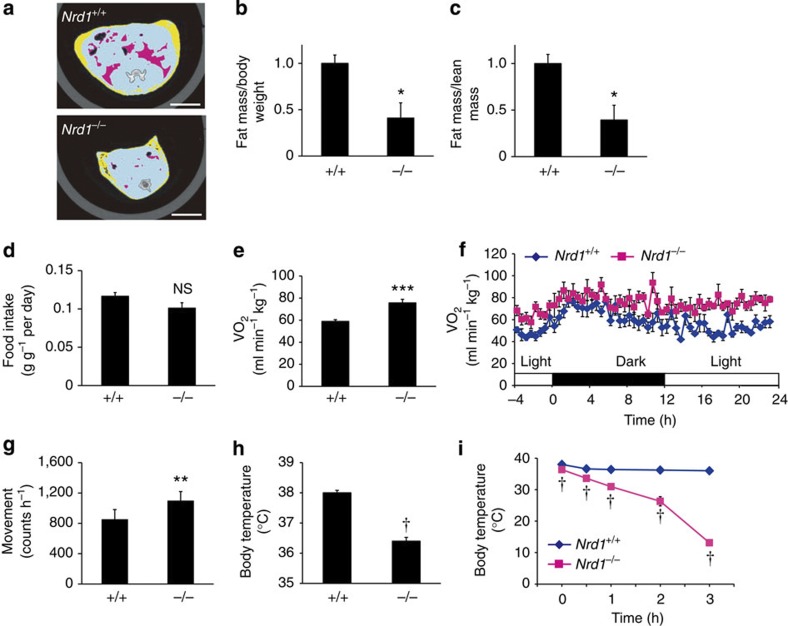
Figure 1. Increased energy expenditure, hypothermia and cold intolerance of Nrd1−/− mice.
(a) Representative CT sections of abdominal regions of 3-month-old Nrd1+/+ and Nrd1−/− mice. Scale bars, 10 mm. (b,c) Ratio of total fat to BW (b) or to lean mass (c) was calculated from CT scan data. Pink areas show visceral fat, while yellow areas show subcutaneous fat. n=3 per genotype. (d) Food intake was measured daily for 7 days and normalized to BW. n=5 per genotype. (e,f) VO2 of 3-month-old Nrd1+/+ and Nrd1−/− mice was monitored in 10 min intervals for 24 h (f) and the average VO2 for 24 h is shown (e). n=6 per genotype. (g) Physical activity was monitored for 7 days. The average movement counts are shown. n=6 per genotype. (h,i) Body temperature of 3-month-old Nrd1+/+ and Nrd1−/− mice at room temperature (h) and after cold (4 °C) exposure (i). n=6 per genotype. All data represent means±s.e.m. *P<0.05, **P<0.005, ***P<0.001, †P<0.0001, NS, not significant (two-tailed Student’s t-test).

