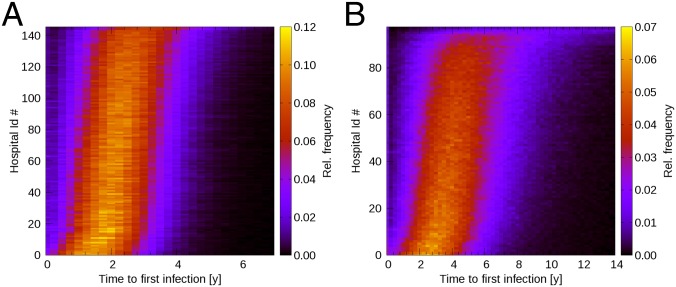
Fig. 1.
Probability, estimated as relative frequency through time, of each individual hospital in England (A) and The Netherlands (B) becoming affected by a novel nosocomial pathogen, following single introduction in a randomly selected hospital at time t = 0. Results obtained in the baseline scenario (β = 0.001 and γ = 0). Hospitals have been sorted along the y axis according to increasing value of median time to first infection.

