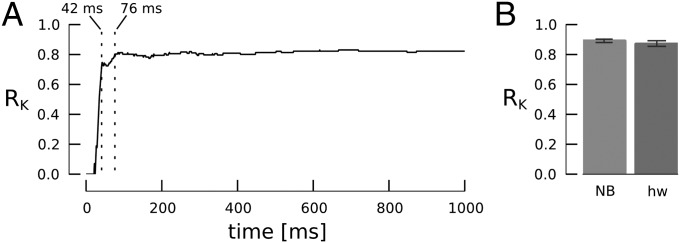
Fig. 3.

Classification performance. (A) RK obtained for decision time points between 0 and 1,000 ms from a single cross-validation run. The vertical dotted lines indicate when RK first exceeds values of 0.7 (42 ms) and 0.8 (76 ms). (B) Classification performance of the hardware classifier network (hw) at decision time of 1 s compared with a naïve Bayes classifier (NB) in fivefold cross-validation. Error bars indicate 20th/80th percentile from 10 repetitions.
