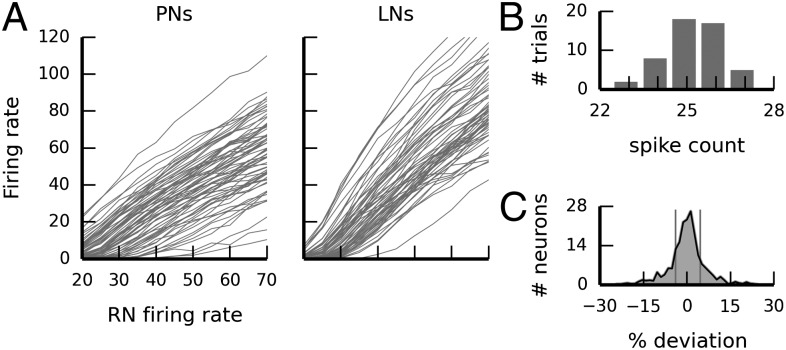
Fig. 4.
Neuromorphic hardware variability. (A) Variability of transfer functions across all PNs and LNs on the hardware chip. Each line corresponds to one neuron. (B) Hardware trial-to-trial variability: Histogram of spike counts for one example neuron across 50 repeated stimulations with identical “frozen input” of 1-s duration (average spike count, 25.3; variance, 1.0). (C) Histogram of per-neuron spike counts relative to the individual average spike count emitted by each of the 192 neurons across 50 repeated identical 1-s stimulations. The vertical lines indicate 20th/80th percentile (P20 = 3.99, P80 = 4.58).

