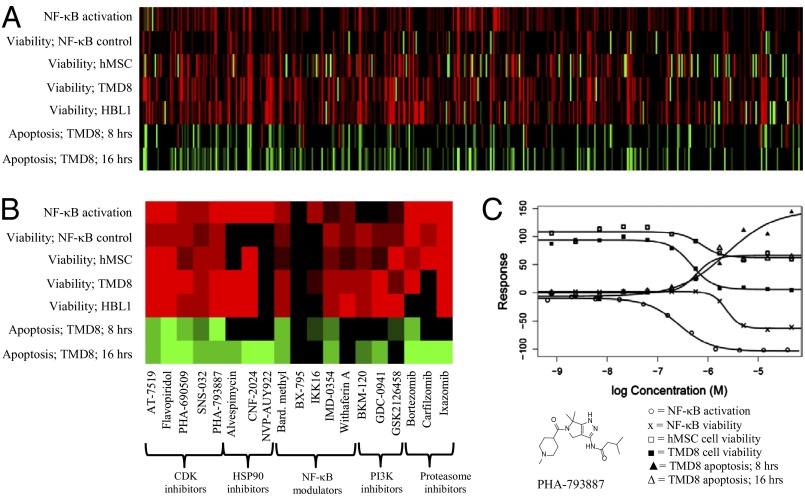
Fig. 1.
(A) Heatmap representation of MIPE library activity derived from qHTS of a previously reported (28) NF-κB assay in agonist (increased transcriptional response) and antagonist (decreased transcriptional response) mode and cell viability (percent cells remaining); control viability in hMSC, TMD8, and HBL1 lines; apoptotic response in TMD8 cells at 8 and 16 h. Red represents inhibitory response; green represents activation response; color intensity represents potency (stronger intensity means lower EC50 value). (B) Expansion of these data for selected agents of interest. (C) Complete response curves from these data sets for the CDK 1–5 inhibitor PHA-793887. [○, NF-κB activation; x, NF-κB viability; □, hMSC cell viability; ■, TMD8 cell viability; ▲, TMD8 apoptotic response (8 h); △, TMD8 apoptotic response (16 h)].

