Fig. 2.
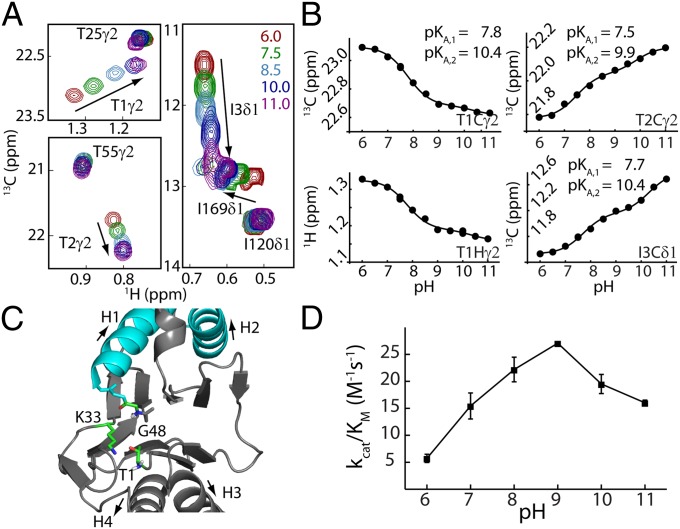
Measurement of active site T1 amine pKa establishes the first step of the catalytic mechanism. (A) Superposition of selected regions of HMQC spectra as a function of pH, focusing on residues T1, T2, and I3. (B) Chemical shift titration data were fit on a per-residue basis to a model that involved ionization of two groups, which is described in the text. The 13C and 1H shifts of a given methyl group were fit simultaneously (e.g., T1γ2). Duplicate measurements at pH 7.5 and pH 10 were used to estimate errors in measured chemical shifts; the error bar is within the size of each dot. (C) Ribbon diagram of a region of a single HlsV monomer highlighting the active site (Protein Data Bank ID code 1G3K). Residues that are critical for the proposed peptidase activity are shown in ball-and-stick representation (SI Appendix). (D) pH profile of HslV peptidase efficiency based on hydrolysis rates of the substrate Z-GGL-AMC (N-carbobenzoxy-Gly-Gly-Leu-amido-4-methylcoumarin; 40 °C).

