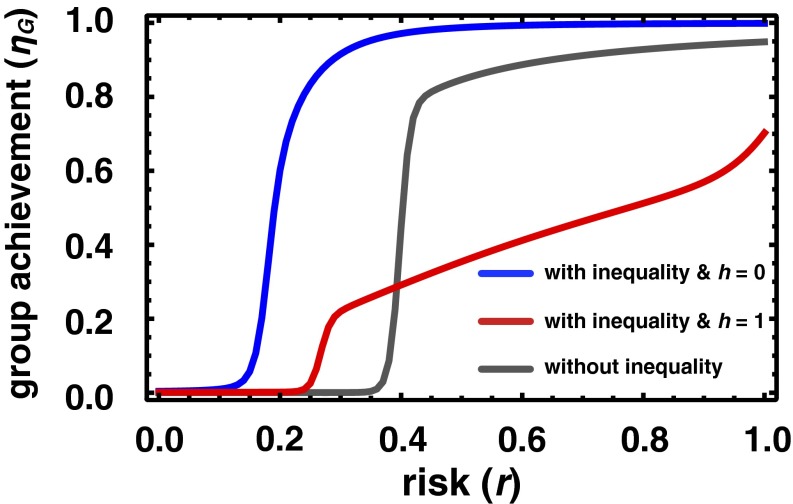
Fig. 1.
Average group achievement ηG as a function of risk. The gray line shows the average group achievement in the case of no wealth inequality; that is, all individuals have an initial endowment b = =1 and the cost of cooperation is 0.1b. The blue line shows results for wealth inequality with the homophily parameter h = 0, whereas the red line shows results for h = 1. We split the population of Z = 200 individuals into ZR = 40 rich (20%) and ZP = 160 poor (80%); initial endowments are bR = 2.5 and bP = 0.625, ensuring that the average endowment
  remains
  =1 (used to generate the gray line); the cost of cooperation also remains, on average, 0.1
 , which means cR = 0.1bR and cP = 0.1bP. The results show that wealth inequality significantly enhances the average chance of group success in the absence of homophily (h = 0), whereas under homophily (h = 1) the fact that only like influences like brings the overall chances of success to levels generally below those under wealth equality. Other parameters (Methods) are N = 6 and M = 3.

