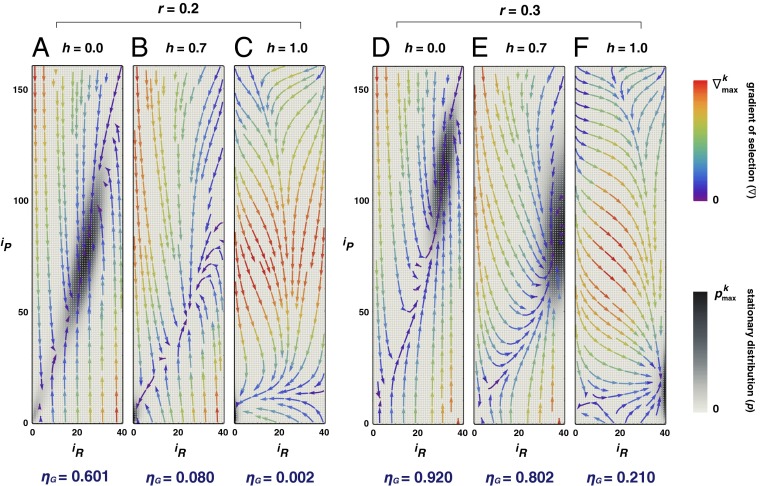
Fig. 2.
Stationary distribution and gradient of selection for different values of risk r and of the homophily parameter h. (A–F) Each panel contains all possible configurations of the population (in total ZR × ZP), each specified by the number of rich (iR) and poor (iP) it contains and represented by a gray-colored dot. Darker dots represent those configurations in which the population spends more time, thus providing a contour representation of the stationary distribution. The curved arrows show the so-called gradient of selection ( ), which provides the most likely direction of evolution from a given configuration. We use a color code in which red lines are associated with higher speed of transitions. The behavioral dynamics of the population depend on the homophily parameter h in a nonlinear way. For h ≤ 0.5, the results remain qualitatively similar to those depicted for h = 0, in which case everybody influences and is influenced by everybody else. In this case, the contribution of the rich is sizeable, which also leads the poor to contribute. For h > 0.5 the behavior changes abruptly, and one witnesses the rapid collapse of cooperation among the poor and, for low risk (r = 0.2, A–C), an ensuing disappearance of contributions to the overall PGG, with the population spending most of the time in full defection, leading to a dramatic impact on the overall group achievement ηG, indicated below each contour plot. However, a slight increase in overall risk perception (here r = 0.3, D–F) actually impels the rich to contribute, despite the fact that the poor still do not cooperate. Other parameters: Z = 200; ZR = 40; ZP = 160; c = 0.1; N = 6; M = 3c
 (
( = 1); bP = 0.625; bR = 2.5;
  ; and
; and  .
.

