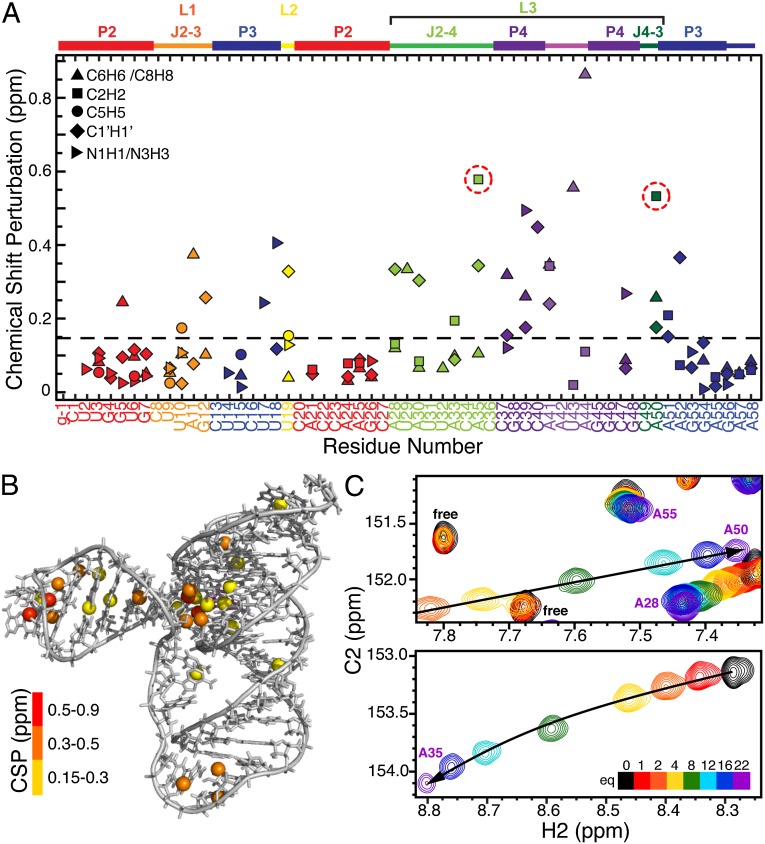
Fig. 6.
Ca2+ dependence of Spn preQ1-II riboswitch. (A) Plot of weighted average chemical shift perturbation (CSP) (from 0 to 22 equivalents of Ca2+) of base C-H and N-H and ribose C1′H1′ as a function of residue number. Values of A35 and A50 C2H2 are circled. (B) CH and NH exhibiting large Ca2+-dependent chemical shifts shown in ball representations in different colors depending on CSP. (C) Regions of 1H-13C HSQC spectra of preQ1-II riboswitch as a function of added Ca2+ in 60 mM KCl and 2 equivalents of preQ1, pH 6.3, at 27 °C, showing chemical shifts of C2H of A50 (Upper) and A35 (Lower).

