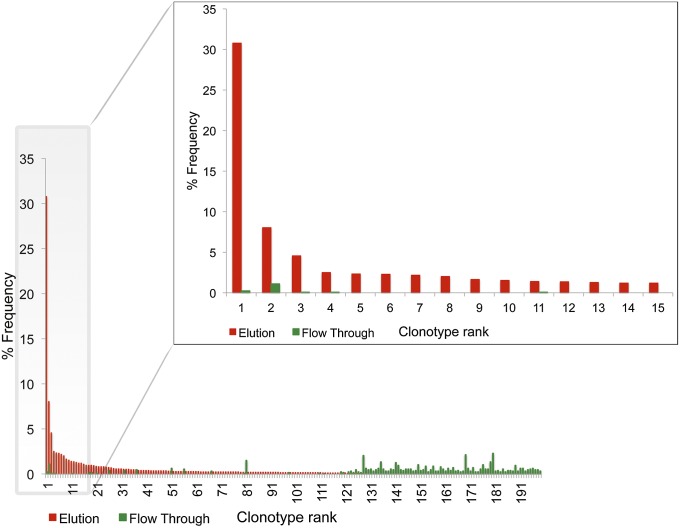
Fig. 1.
Representative histogram of antibody clonotype frequencies identified proteomically in the F(ab′)2 elution and flow-through fractions following TT affinity purification. The histogram shown depicts the 3-mo postboost serum IgG repertoire for HD1. Frequencies shown here were calculated by adding the CDR-H3 spectral counts for all peptides mapping to a single clonotype.

