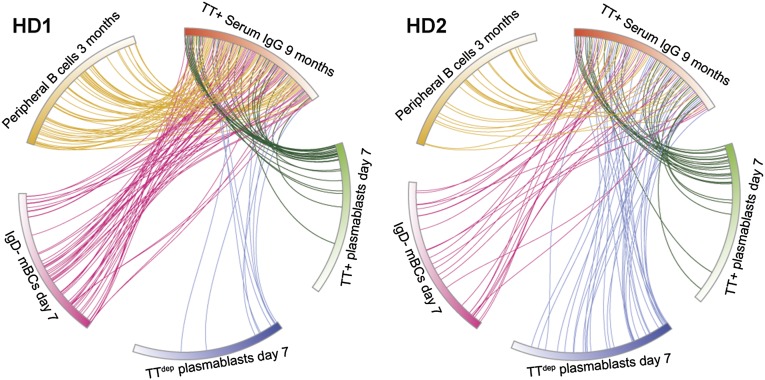
Fig. 3.
Circos plots show the relationship between the B-cell and TT+ serum IgG repertoire. Postboost steady-state (9 mo) TT+ serum IgG clonotypes (red section, ordered clockwise by frequency) and the V gene repertoire clonotypes determined by 454 sequencing of each B-cell subset, ordered clockwise by frequency, in HD1 (Left) and HD2 (Right) are shown. IgD− mBC day 7: CD3−CD14−CD19+CD27+CD20+IgD−, TT+ plasmablasts day 7: CD3−CD14−CD19+CD27++CD38++CD20−TT+, TTdep plasmablasts day 7: CD3−CD14−CD19+CD27++CD38++CD20−. Even though some low-abundance TT+ serum IgG clonotypes solely map to day 7 TTdep plasmablasts, these cells did not stain with antigen by FACS, likely due to varying levels of B-cell receptor expression and affinities for the antigen-dye conjugate. Peripheral B cells 3 mo: combined IgD− mBCs and total plasmablast cells. Clonotype numbers for each population are provided in Table S1.

