Fig. 1.
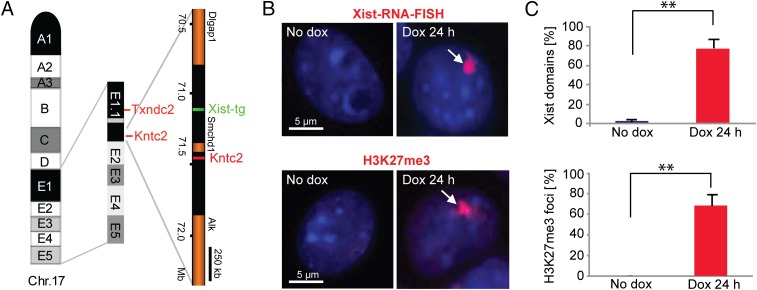
Analysis of Xist expression and H3K27me3 localization in undifferentiated 3E ES cells. (A) Schematic representation of chromosome 17 (Chr. 17) and magnification of the cytological region encompassing the inducible Xist transgene (Xist-tg) as determined by DNA-FISH mapping of flanking loci Txndc2 and Kntc2 (30). Genomic coordinates are from mm8 assembly. (B) Representative images of Xist RNA-FISH and H3K37me3 IF stainings on 3E cells 24 h after Xist induction with doxycycline (dox). No Xist up-regulation is detected in noninduced cells. (C) Quantification of cells with Xist RNA and H3K27me3 foci (n ≥ 200). Error bars represent SD in three independent experiments. Two asterisks (**) indicate high statistical significance (P ≤ 0.001, t test).

