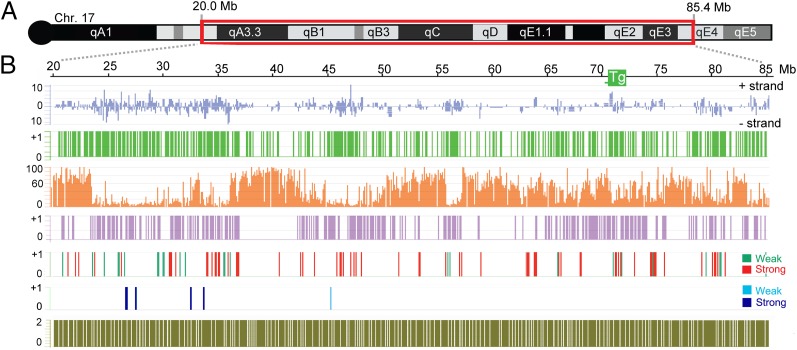
Fig. 2.
Summary of epigenomic and transcriptional profiling of chromosome 17 in 3E ES cells following Xist-transgene induction. (A) Schematic showing tiled chromosome 17 region corresponding to Mb 20–85.4 (mm8). (B) Chromosome 17 features are as follows: gene density on + and − strands (blue), CGI density (green), L1 repeat density (%, orange), Xist-dependent new H3K27me3 peaks acquired 24 h after transgene induction (violet), Xist-mediated gene silencing 72 h after transgene induction indicating strongly (red) and weakly (green) down-regulated genes, strongly (dark blue) and weakly (light blue) down-regulated genes, and density of tiled probes (olive). 0/+1 indicates the absence or presence of a given feature (CGI, new H3K27me3 peaks, etc.).

