Fig. 5.
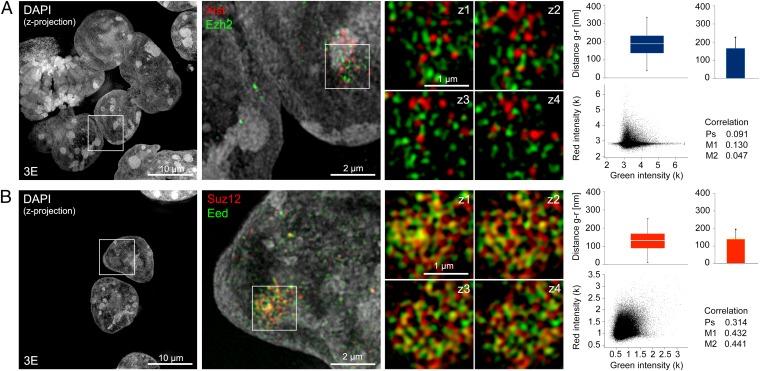
Spatial separation of Xist RNA and Ezh2 determined by 3D-SIM. (A) Example of immuno-RNA-FISH for Xist (red) and Ezh2 (green) illustrating a maximum intensity z-projection of DAPI-stained cell nuclei (Left and Center), a magnified region surrounding the Xist RNA-enriched domain in one of the cells (Center), and four further magnified serial z-sections (125-nm z-distance, Right) centered on the “Barr body.” Graphs illustrate distance and colocalization analysis from the entire Barr body region (∼15 z-sections). (Upper) Nearest neighbor distances for segmented green and red signals (Distance g-r) are displayed as box plots (median, Q1, Q3), with whiskers indicating the 1.5× interquartile range (1.5 IQR), and as averages plus SD. (Lower) Colocalization analysis based on pixel intensities displayed as a green-red scatter plot with Pearson’s (Ps), Manders’ 1 (M1), and Manders’ 2 (M2) correlation coefficients is indicated. Averaged values from multiple cells are shown in Fig. 4 A and B. (B) IF detection of PRC2 proteins Suz12 (red) and Eed (green) with panels arranged as in A.

