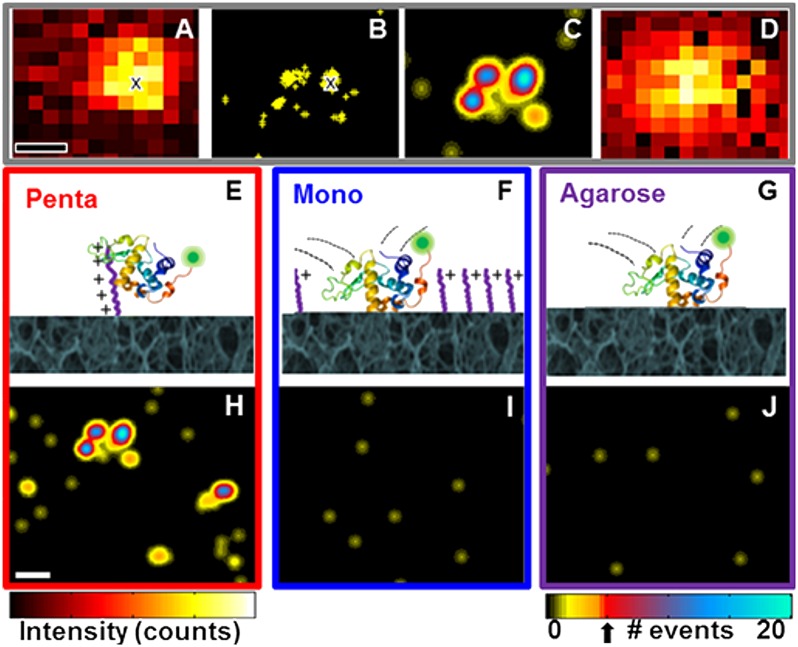
Fig. 1.
Superresolution imaging procedure and pseudo images at respective interfaces. (A–C) Steps to obtain superresolution pseudo images. (A) Single frame with an adsorbed α-lactalbumin protein. The centroid location obtained by a 2D Gaussian fit of the point spread function is noted by “x”. (B) Centroid locations obtained from localizing 114 individual point-spread functions from 3,000 frames; location of centroid in A is indicated by “x”. (C) Superresolution pseudo image from 3,000 frames depicting location and number of individual adsorption events. Specific adsorption sites were identified by the detection of more than five adsorption events (threshold indicated by arrow below color bar). (D) Summed diffraction-limited image from 3,000 frames for comparison with superresolved image. (E–G) Schemes and (H–J) superresolution pseudo images for α-lactalbumin at three stationary phase interfaces: (E and H) pentaargininamide, (F and I) monoargininamide, and (G and J) agarose, respectively. Data collected from 3,000 frames over 3.1 min are shown. Protein structure from PDB based on Chandra, et al. (69). (Scale bars: 200 nm.) Intensity scales range from (A) 50–1,800 and (D) 2–4 × 10⁵ counts.

