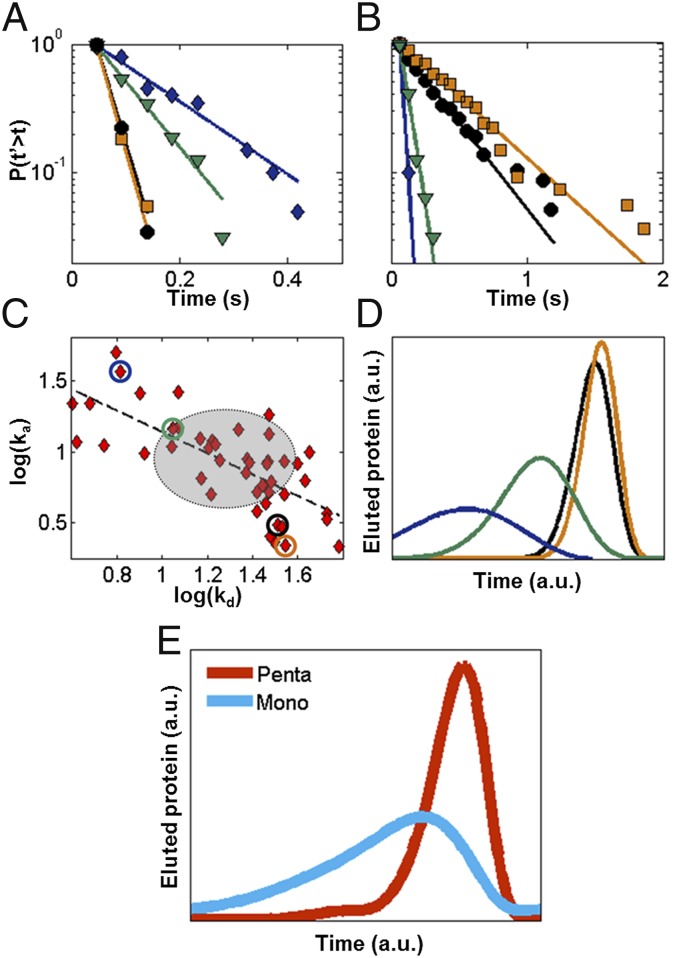
Fig. 3.
Kinetics and elution profiles obtained from single-molecule data. Cumulative distributions of (A) desorption and (B) adsorption times and respective fits (solid lines) for the four individual pentaargininamide adsorption sites shown in the superresolution pseudo image in SI Appendix, Fig. S6. (C) Relationship between kd and ka for 53 individual sites, with displayed locations in A noted by colored circles. A linear trend is observed indicated by the dashed line, as opposed to a 2D normal distribution represented by the gray circle (mean ± SD). (D and E) Relative ensemble isocratic chromatographic elution profiles obtained from single-molecule data using stochastic theory. (D) Elution curves for the four individual pentaargininamide adsorption sites. (E) Elution curves for ensemble of specific adsorption events for pentaargininamide (n = 603) and clustered monoargininamide (Fig. 2B, light blue, 10 × 104%; n = 1,706). Data were obtained over 5.2 min.

