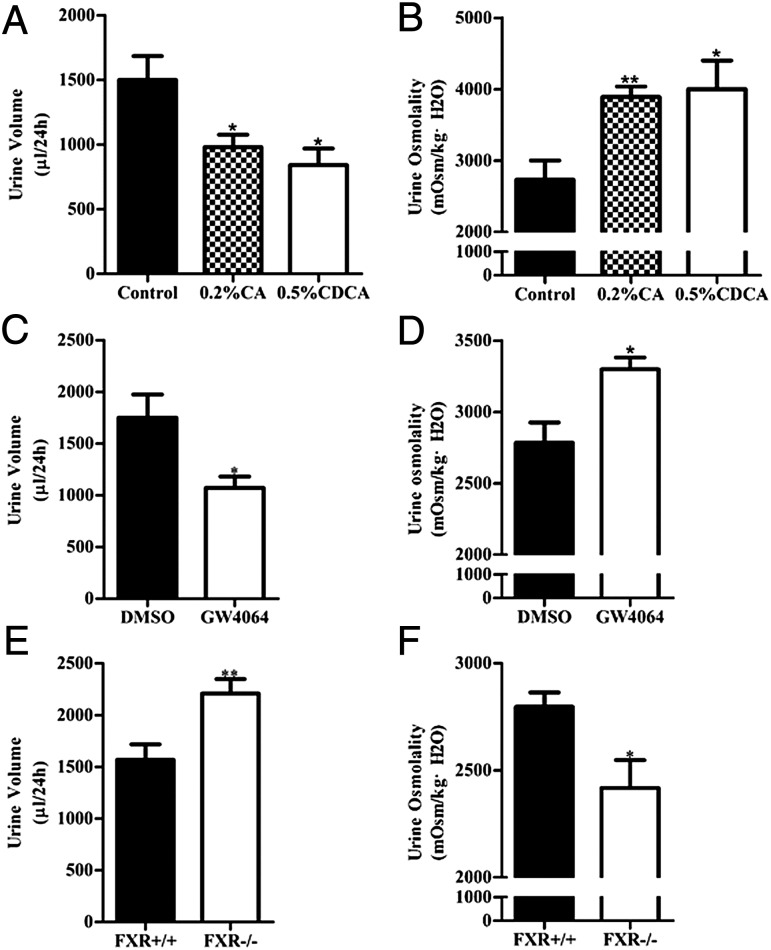
Fig. 2.
Role of FXR in the regulation of mouse urine volume and osmolality. (A and B) Urine volume (A) and osmolality (B) of control, 0.2% CA-, and 0.5% CDCA-fed mice, n = 5 in each group. (C and D) Twenty-four-hour urine volume (C) was significantly lower, whereas urine osmolality (D) was significantly higher, in GW4064-treated mice (n = 5) than in control mice (n = 6). (E and F) Twenty-four-hour urine volume (E) was significantly higher, whereas urine osmolality was significantly lower (F), in FXR gene knockout (FXR−/−) mice (n = 17) than in wild-type (FXR+/+) mice (n = 13). Data are presented as mean ± SEM. *P < 0.05, **P < 0.01 vs. control (A and B), DMSO (C and D), or FXR+/+ mice (E and F).

