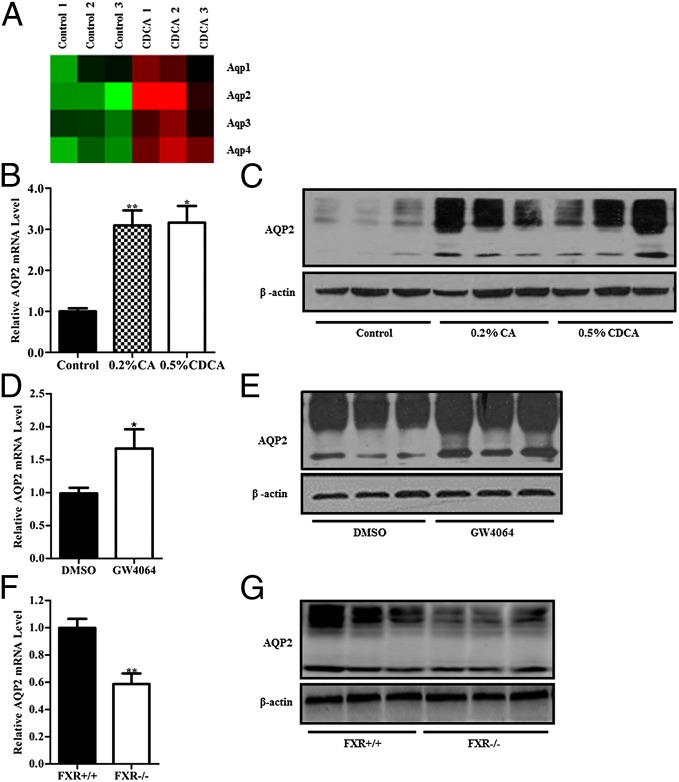
Fig. 3.
Effect of FXR on AQP2 expression in mouse kidney. (A) Heat map visualization of changes of four major aquaporins in the kidneys of CDCA-fed mice. AQP2 was the one with the most significantly induction. Fold change of each gene symbol was visualized by red–green color scale: green for down-regulation, black for insignificant change, and red for up-regulation. (B and C) Both mRNA (B) and protein (C) levels of AQP2 were increased in the kidneys of 0.2% CA- and 0.5% CDCA-fed mice. (D and E) Treatment of mice with a specific FXR agonist, GW4064, via i.p. injection for 3 d up-regulated AQP2 expression at both mRNA (D) and protein (E) levels in the kidneys. (F and G) FXR gene-deficient mice exhibited diminished AQP2 expression at both mRNA (F) and protein (G) levels. Data are presented as mean ± SEM. *P < 0.05, **P < 0.01 vs. control (A and B), DMSO (C and D) or FXR +/+ mice (E and F). β-Actin was used as an internal control.

