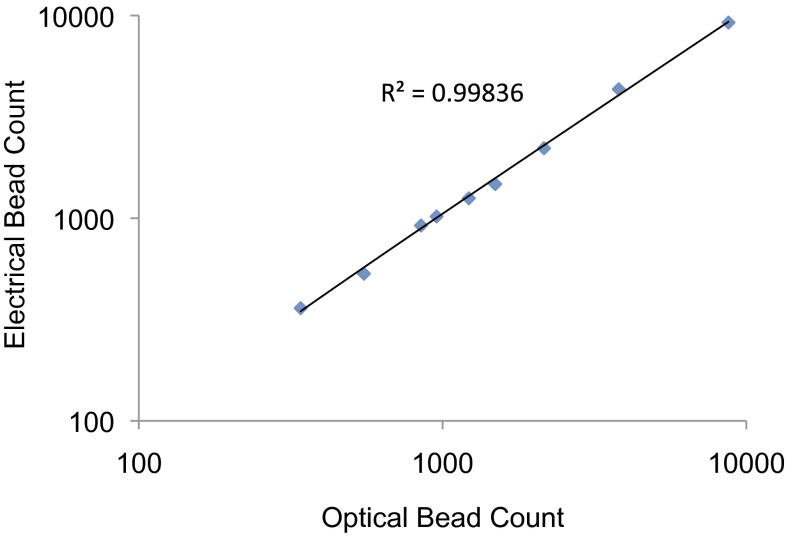
Fig. 2.
Evaluation of electrical impedance sensor accuracy. Varying concentrations of immunobound beads in the capture/reaction chamber were optically quantified before being eluted. The eluted beads were directed toward the detection chamber where they were recounted electrically. Shown is a graph of optical bead counts as a function of electrical bead counts. A linear trend with R2 = 0.9984 was observed.

